
FIGURE 2.
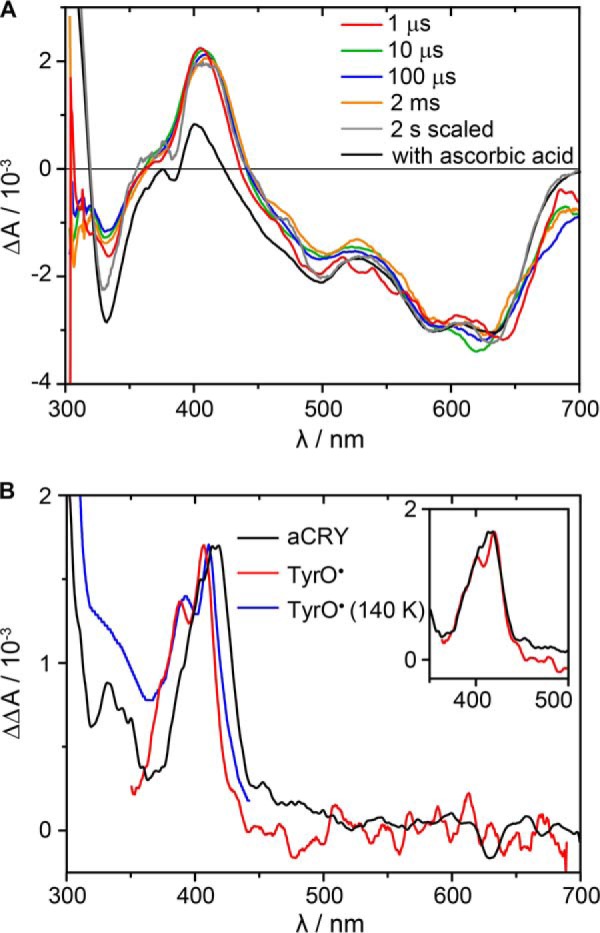
Microsecond time-resolved UV-vis spectra of the red light response in aCRY. A, pre-illuminated samples were excited with 630 nm laser pulses to selectively convert FADH• to FADH−. Spectra were recorded at indicated time points. For comparison, a steady state spectrum of the FADH• to FADH− conversion in the presence of 0.1 mm ascorbic acid is shown. B, double difference spectrum of the 1 μs spectrum minus the steady state spectrum was calculated. The comparison to reference spectra of TyrO• in water (red) (29) and at 140 K (blue) (30) reveals a red shift. A complete match is obtained by shifting the reference spectrum by 9 nm (inset).