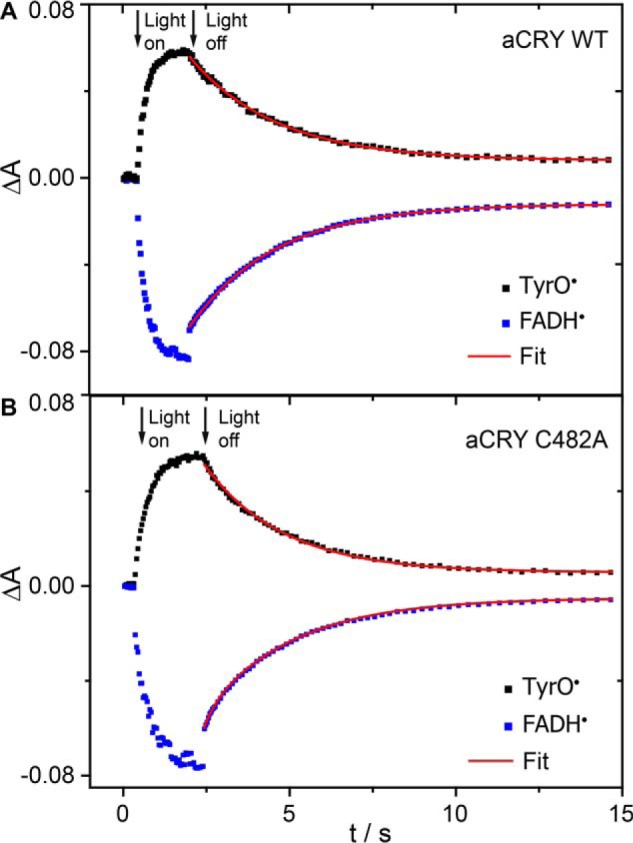
FIGURE 3.

Kinetic analysis of the red light response in aCRY. A, pre-illuminated sample of wild-type aCRY was illuminated for 2 s with 632 nm to selectively convert FADH• to FADH−. The recovery of FADH• and the decay of TyrO• were analyzed with a monoexponential fit using the marker bands at 615–643 nm and 395–420 nm, respectively. Both processes show the same time constant of 2.6 s. B, these time constants change only slightly to 2.3 s in the C482A mutant of aCRY speaking against an efficient pathway of thiol oxidation by TyrO•.
