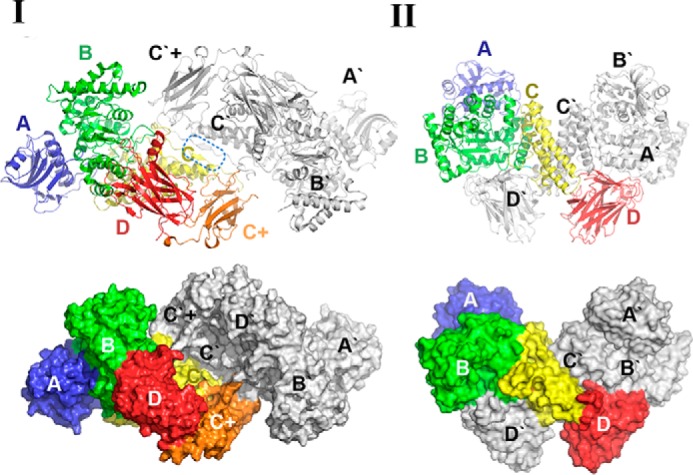
FIGURE 4.

The dimerization of SdeAgu115A in comparison with BoAgu115A. I, dimerization pattern of SdeAgu115A. II, dimerization pattern of BoAgu115A. Side by side comparison between SdeAgu115A and BoAgu115A reveals different dimer formation schemes, which are presented in both schematic and surface forms. Each domain in protomer 1 is labeled and colored for clarity (blue for domain A, green for domain B, yellow for domain C, orange for domain C+, and red for domain D), whereas all domains from protomer 2 are colored in gray.
