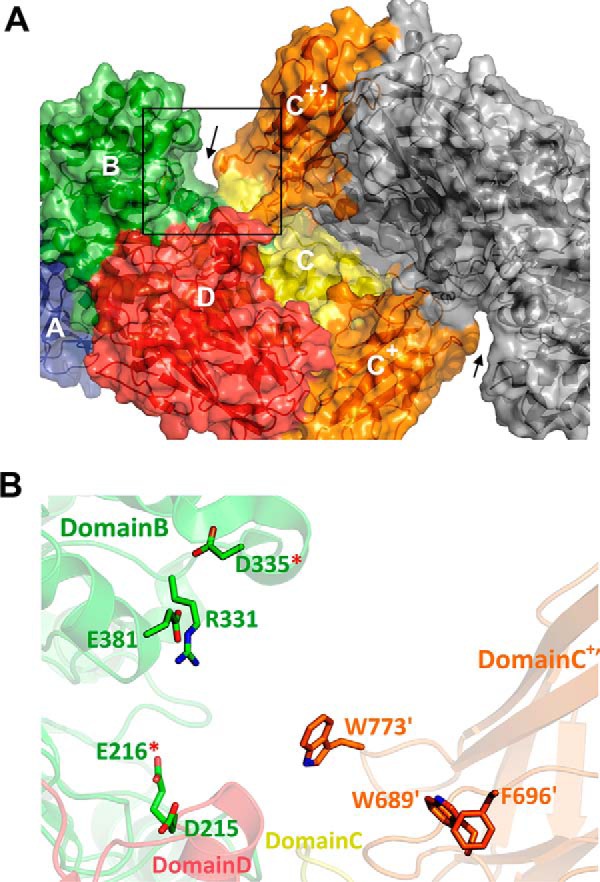
FIGURE 5.

The active site region in SdeAgu115A. A, surface representation of the overall structure of SdeAgu115A dimer, with one of the active site regions highlighted by the rectangular box. B, close-up of the highlighted area that is formed by domains B (green), C (yellow), and D (red) from protomer A and domain C+′ (orange) from protomer B. The side chains of the candidate residues tested for their role in catalysis and substrate binding are displayed as sticks and labeled.
