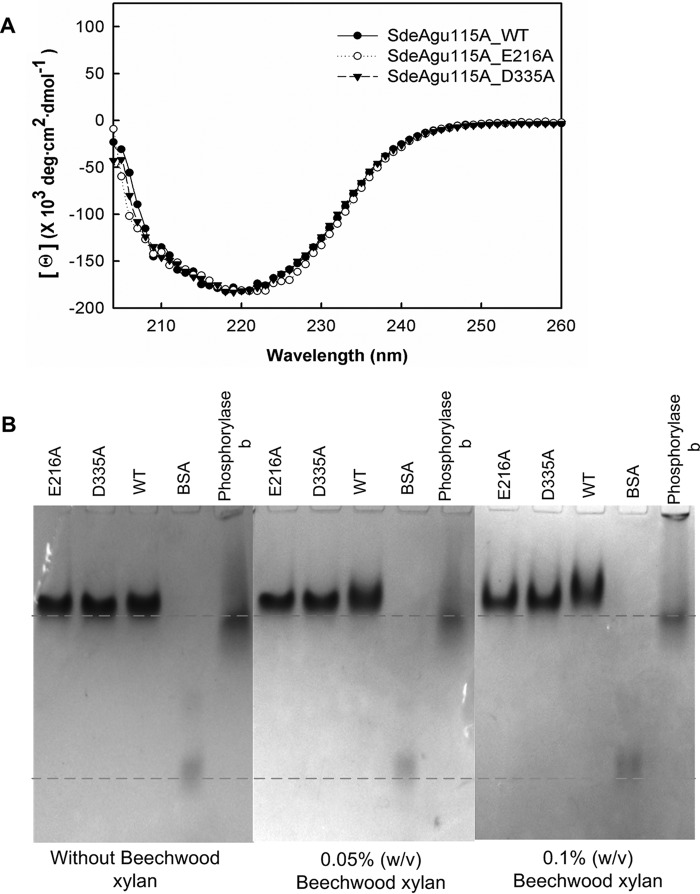
FIGURE 6.
CD spectra and affinity gel electrophoresis analysis of SdeAgu115A and E216A and D335A variants. A, CD spectra of SdeAgu115A along with E216A and D335A variants displayed similar overall structure. B, affinity gel electrophoresis analysis with beechwood xylan. The protein band in the BSA lane represents the BSA dimer.

