
FIGURE 1.
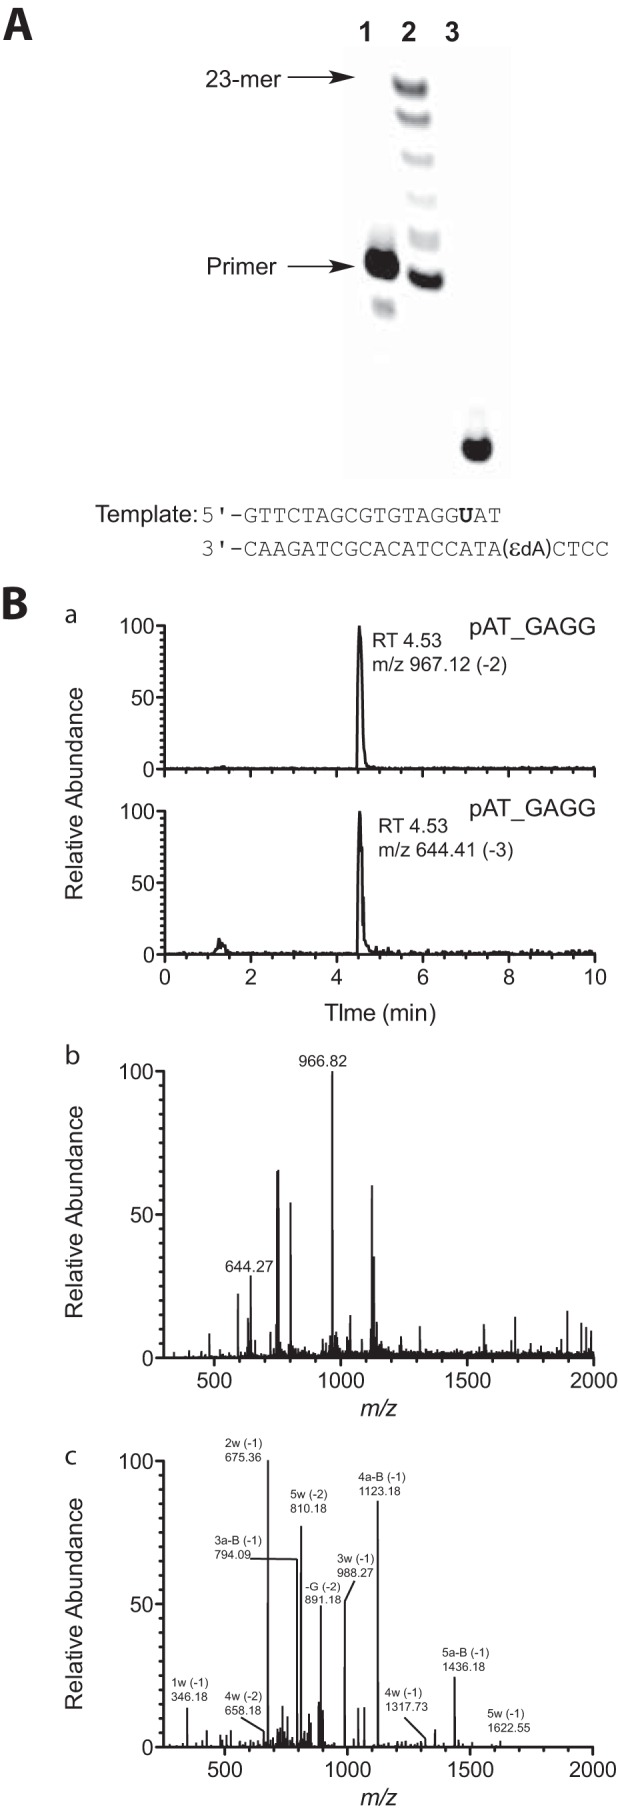
LC-MS analysis of products of extension of primer (opposite template 1,N6-ϵdA, substrate C-U, Table 1) by hpol η in the presence of all four dNTPs. A, denaturing PAGE image showing hpol η extension across the 1,N6-ϵdA adduct: lane 1, 18-mer oligonucleotide primer containing a 5′-FAM label (from substrate C-U, Table 1); lane 2, TLS polymerase extension reaction with hpol η and 18-mer primer/23-mer template duplex (substrate C-U, Table 1); lane 3, cleavage of hpol η extension reaction products with UDG and piperidine. B, mass spectra of frameshift product pAT_GAGG (relative abundance of total ion current measured) (underscore denotes frameshift): panel a, LC chromatograms of product ions m/z 967 (−2 charge) and m/z 644 (−3 charge); panel b, mass spectrum of peak eluted at tR 4.53 min in panel b (product mixture); panel c, CID spectrum of m/z 967. See supplemental Table S1 for assignments.