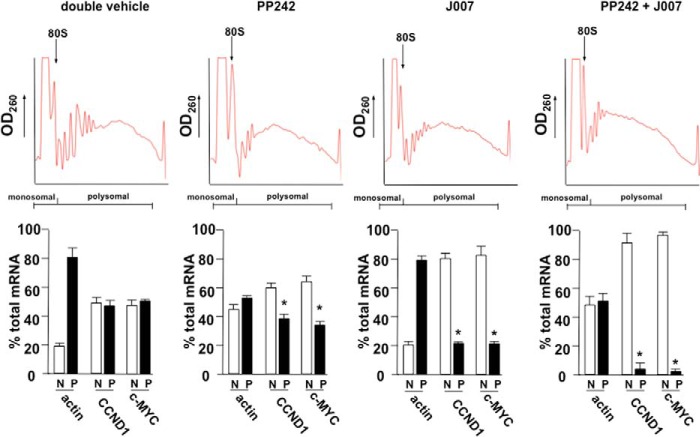
FIGURE 7.
Cyclin D1 and c-MYC mRNA translational state in subcutaneous LN229 GBM tumors in response to combination IRES and mTOR inhibitor therapy. Polysome distributions of cyclin D1, c-MYC, and actin mRNAs from xenografted tumors harvested from mice receiving the indicated treatment schedules. Tumor extracts were subjected to sucrose density gradient centrifugation, fractionated, and pooled into a nonribosomal monosomal fraction (N, white columns) and a polysomal fraction (P, black columns). Purified RNAs were used in real-time quantitative RT-PCR analysis to determine the distributions of cyclin D1, c-MYC, and actin mRNAs across the gradients. Polysome gradient tracings are shown above each graph. Mean ± S.D. are shown for quadruplicate RT-PCR measurements. *, p < 0.05.

