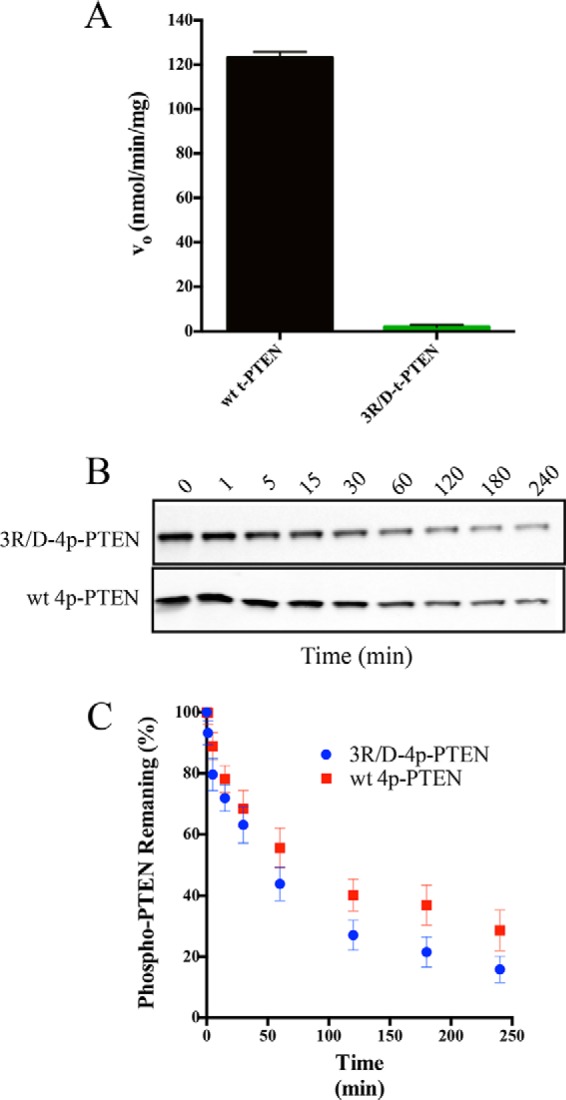
FIGURE 7.

Conformational analysis of the 3R/D PTEN mutant. A, catalytic activity of WT t-PTEN (123 ± 4 nmol/min/mg) compared with 3R/D t-PTEN (<4 nmol/min/mg) with 160 μm diC6-PIP3 (n = 2). B, Western blot of time course of dephosphorylation of alkaline phosphatase-treated 3R/D-4p-PTEN (R41D, R47D, and R74D) and WT 4p-PTEN. C, quantification of the alkaline phosphatase assay for 3R/D-4p-PTEN and WT 4p-PTEN (n = 6). Error bars indicate ± standard error.
