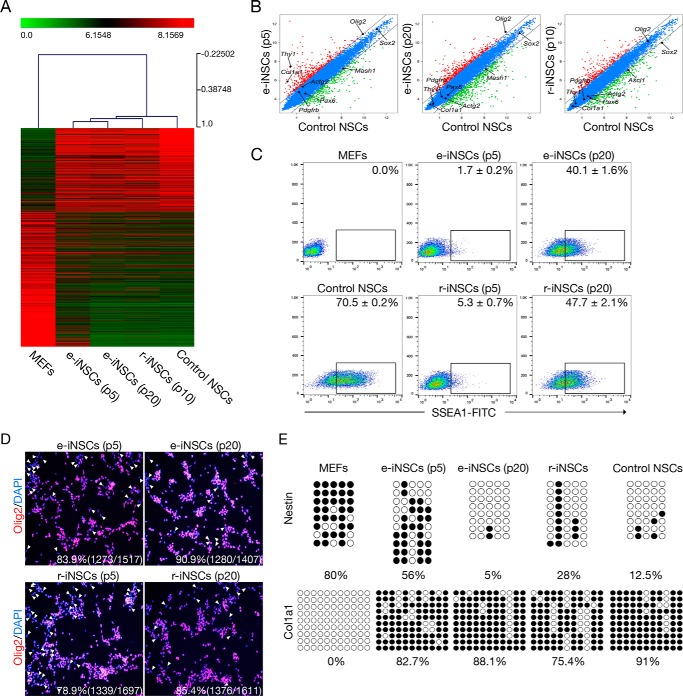
FIGURE 2.
A gradual conversion process into iNSCs. A, heat map representing the global gene expression profile of MEFs, e-iNSCs (passages 5 and 20), r-iNSCs (passage 10), and control NSCs. Genes that are more than 4-fold differentially expressed between MEFs and control NSCs are represented. The color bar at the top of the heat map indicates gene expression in log2 scale. Red and green colors represent higher and lower expression levels, respectively. B, pairwise scatter plot analysis of the global gene expression profiles of MEFs, e-iNSCs (passages 5 and 20), r-iNSCs (passage 10), and control NSCs. The black lines delineate the boundaries of 2-fold difference in gene expression levels. C, FACS analysis of early (p5) and late passage (p20) of both e-iNSCs and r-iNSCs using antibody against SSEA1. D, immunofluorescence microscopy images of early (p5) and late (p20) passage of both e-iNSCs and r-iNSCs using antibody against Olig2. The Olig2-negative cells are indicated by arrowheads. E, DNA methylation status of second intron of Nestin and promoter region of Col1a1 in MEFs, e-iNSCs (passage 5 and 20), r-iNSCs (passage 10), and control NSCs was assessed by bisulfite sequencing PCR. Open and filled circles represent unmethylated and methylated CpGs, respectively.

