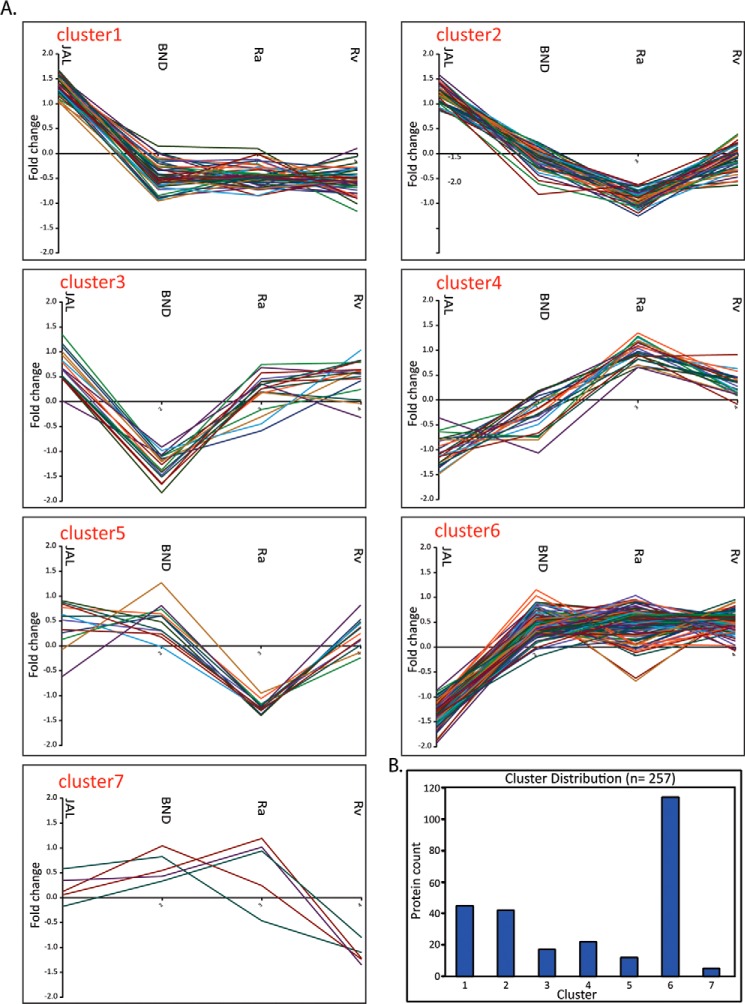
FIGURE 5.
K-means cluster analysis of ANOVA-significant proteins. A, proteins showing significant protein abundance changes were grouped into seven clusters. Median of Z-scored log 2 normalized values for each quadruplicate was used for cluster analysis. Matlab was utilized for K-means clustering. B, bar chart showing the number of protein in each cluster.

