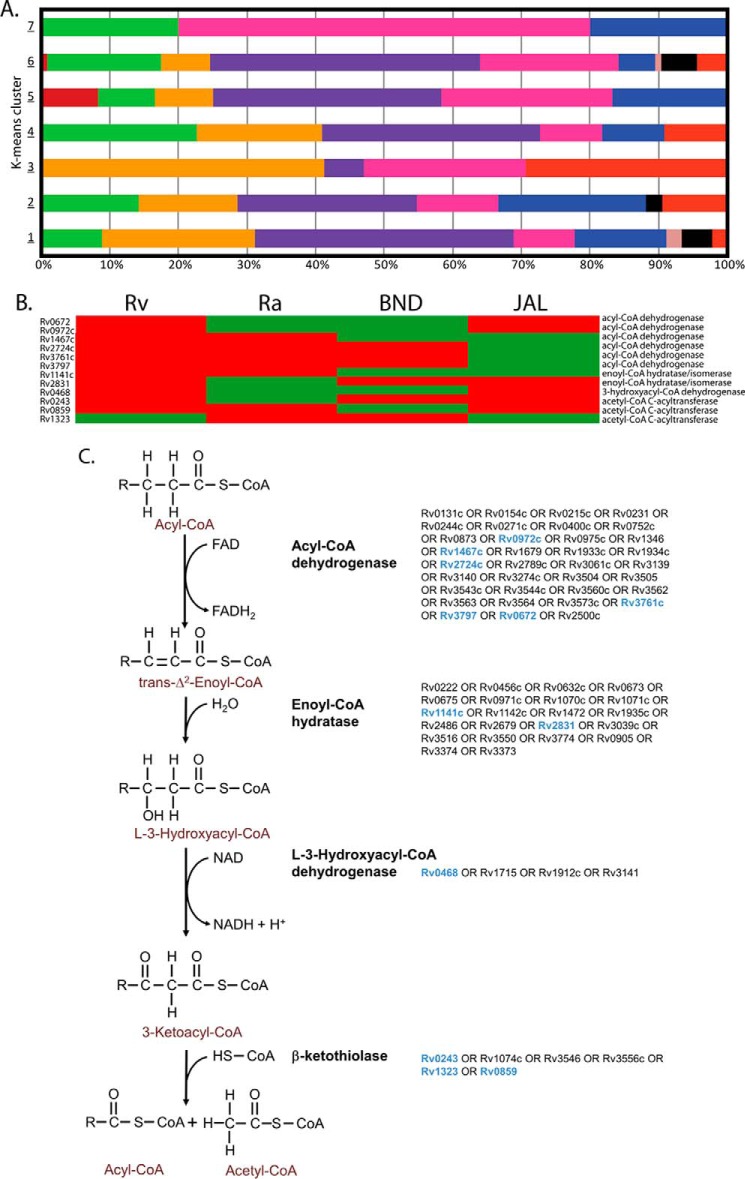
FIGURE 6.
Distribution among the K-mean clusters. A, bar chart showing the percentage of tuberculist functional categories present in each cluster. B and C, metabolic pathway for the β-oxidation of fatty acids. B, clustergram of the 12 differentially expressed proteins across the four M. tuberculosis strains in the subsystem β-oxidation of fatty acids. The Z-scored normalized abundance values of proteins are represented by red (high abundance) and green (low abundance) colors. C, β-oxidation of fatty acids is accomplished by four enzyme-catalyzed reactions as given in the outline. This pathway is highly redundant at the level of genes encoding the associated enzymes for the four reactions. In the M. tuberculosis genome, there are 35 predicted genes for acyl-CoA dehydrogenase, 22 predicted genes for enoyl-CoA hydratase, 4 predicted genes for l-3-hydroxyacyl-CoA dehydrogenase, and 6 predicted genes for β-ketothiolase (indicated). The differentially expressed genes in the β-oxidation pathway across the four M. tuberculosis strains are indicated in blue.

