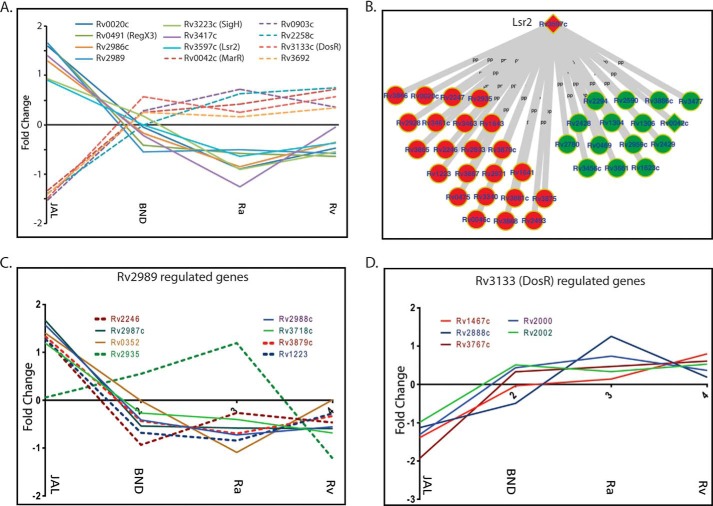
FIGURE 7.
Protein levels of transcription factors vary among the strains. A, profile plots showing the fold change of different transcription factors found among the 257 ANOVA-significant proteins. B, Galagan network analysis of transcriptional factors. C, profile plots showing the fold change of the target proteins, whose expression is regulated by Lsr2. D, profile plots showing the fold change of the target proteins whose expression is regulated by R2839.

