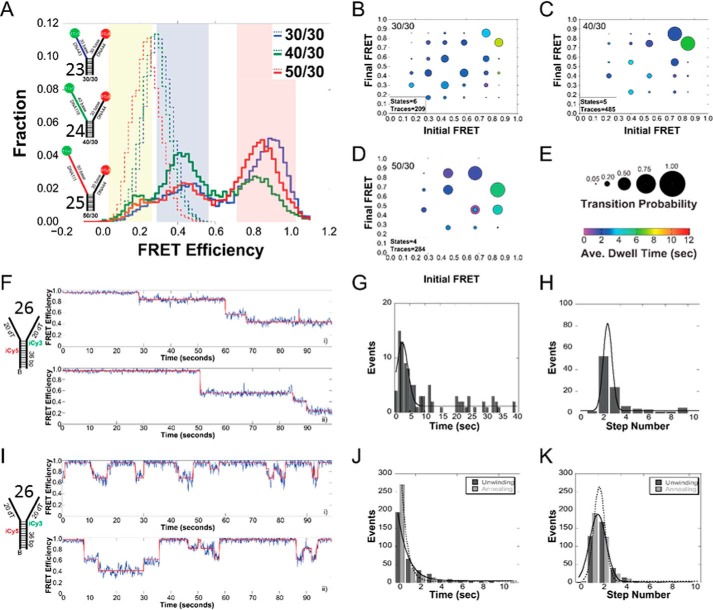
FIGURE 9.
Histograms and ExPRT plots of Twinkle bound to DNA forks. A, histogram of the FRET signals from the 30/30 DNA fork substrate (substrate 23) (blue), 40/30 DNA fork substrate (substrate 24) (green), and 50/30 DNA fork substrate (substrate 25) (red), DNA fork substrates alone (dashed lines) and after addition of 25 nm Twinkle (solid lines). The length of the 5′-translocating strand was kept constant at 30 (dT) nucleotides, and the length of the 3′ excluded strand was varied from 30 to 50 (dT) nucleotides. Yellow, blue, and red regions indicate low, medium, and high FRET states, respectively. ExPRT plots for Twinkle bound to the 30/30 (B), 40/30 (C), and 50/30 (D) DNA forks. Each marker on the ExPRT plot represents a transition from the initial FRET state on the x axis to the final FRET state on the y axis. E, size of the marker corresponds to the fraction of analyzed traces that exhibit that particular transition (transition probability), and the color represents the dwell time (seconds) of the initial state. Representative traces from smFRET experiments showing undirectional unwinding (F) or alternating unwinding and reannealing (I) for substrate 26. The calculated FRET signal is shown in blue, and the fit to ideal states is overlaid in red. A global quantification of the unwinding time or number of steps for unidirectional unwinding (G and H) or alternating unwinding and reannealing (J and K). For multistate smFRET traces, the individual unwinding (dark gray) and annealing (light gray) times and steps are quantified individually. The lines correspond to fits to a Gaussian equation.

