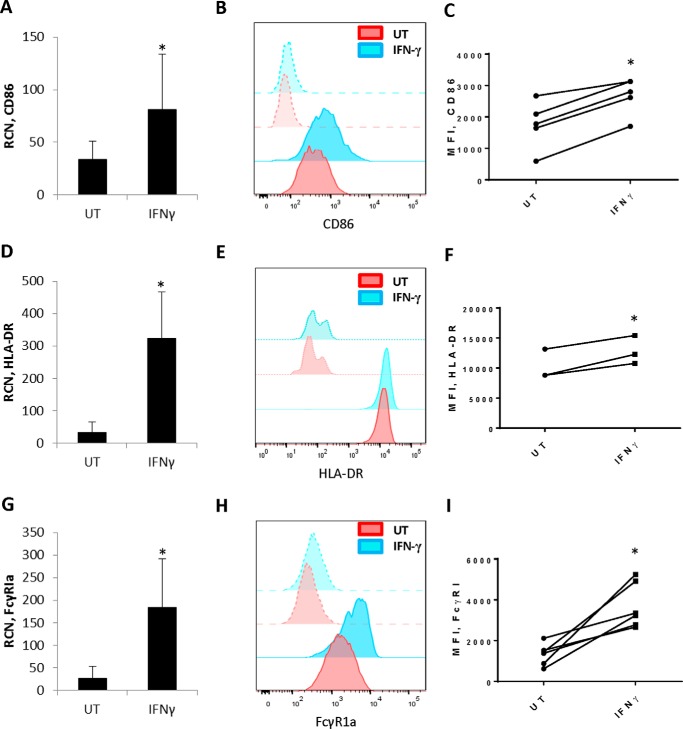
FIGURE 2.
IFNγ elicits expression of CD86, HLA-DR and FcγRIa in NLCs. NLCs were generated as described under “Experimental Procedures.” NLCs were treated with or without 10 ng/ml IFNγ for 72 h. A, D, and G, qPCR done to measure CD86 (A, n = 6), HLA-DR (D, n = 4), and FcγR1 (G, n = 6). B, E, and H, NLCs were treated as above, and flow cytometry was done for CD86 (B), HLA-DR (E), and FcγRI (H). Histograms show fluorescence intensity of each respective marker. Solid red, untreated (UT); transparent red, isotype control; solid blue, IFNγ-treated, transparent blue, isotype control. Representative histograms are shown. C, F, and I, mean fluorescence intensity (MFI) for CD86 (C, n = 5), HLA-DR (F, n = 3), and FcγRI (I, n = 6). *, p ≤ 0.05.

