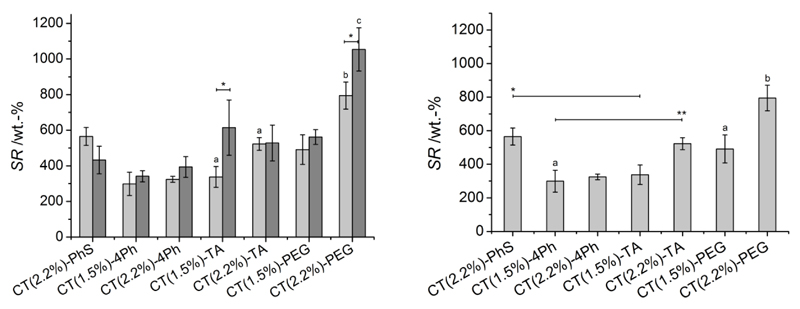
Figure 3.
Left: Swelling ratio (SR) of CT-based hydrogels following equilibration in either distilled water (grey) or PBS (light grey) at room temperature. ‘*’ and ‘a’ indicate that related mean differences are significant at 0.05 level (Bonferroni test). ‘b’ and ‘c’ indicate that corresponding mean values are significantly different to all mean values described in the plot (at 0.05 level, Bonferroni test). Right: SR of CT-based hydrogels following equilibration in PBS at room temperature. ‘*’ and ‘**’ indicate that corresponding mean values are significantly higher compared to all other mean values described below the black line (at 0.05 level, Bonferroni test); ‘a’ indicates that compared mean values are significantly different between each other at 0.05 level (Bonferroni test); ‘b’ indicates that corresponding mean value is significantly different from all other mean values described in the plot (at 0.05 level, Bonferroni test).

