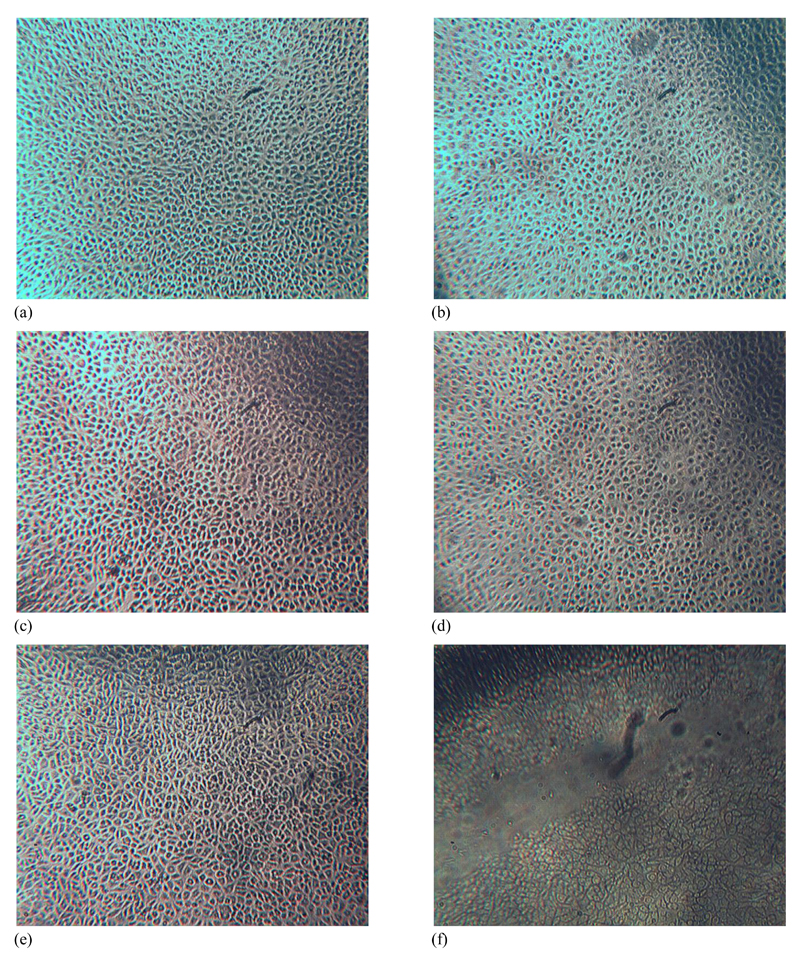
Figure 10.
Cell morphology of L929 mouse fibroblasts cultured at different time points during 48-hour culture in sample extracts, DMEM as positive control and DMSO as negative control. (a, c): morphology of cells cultured in Collagen-Ph0.5 following 24 (a) and 48 (c) hours cell culture; (b, d): morphology of cells cultured in Collagen-Ph1.5 following 24 (b) and 48 (d) hours cell culture; (e, f): morphology of cells cultured in DMEM (e) and DMSO (f) following 48 hours cell culture.

