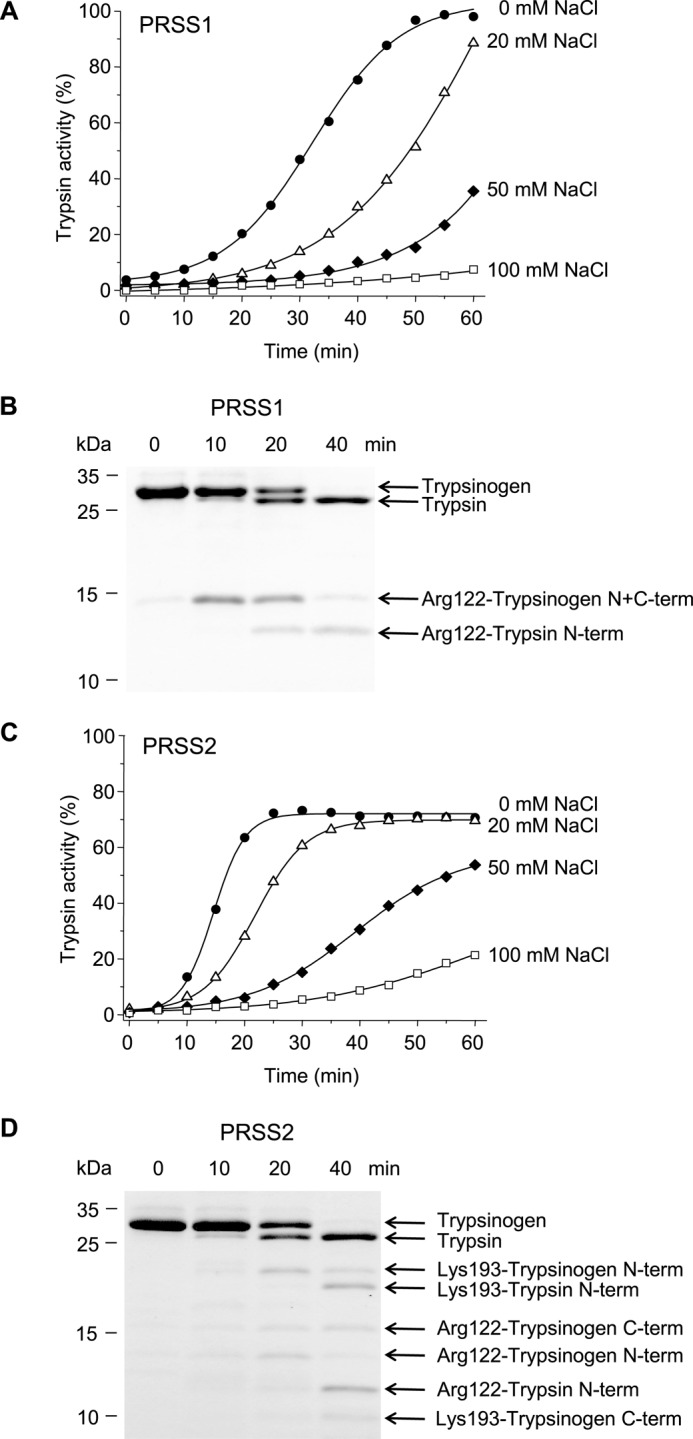
FIGURE 2.

Autoactivation of human cationic (PRSS1, A and B) and anionic trypsinogen (PRSS2, C and D). Trypsinogen (1 μm) was incubated at 37 °C with 10 nm initial trypsin in 0.1 m Tris-HCl (pH 8.0), 1 mm CaCl2, 0–100 mm NaCl, and 0.05% Tween 20 (final concentrations). A and C, at the indicated times aliquots (10 μl) were removed, and trypsin activity was determined and expressed as described under “Experimental Procedures.” B and D, trypsinogen (150 μl) was precipitated with 10% trichloroacetic acid (final concentration) and analyzed by reducing SDS-PAGE and Coomassie Blue staining. Gels shown correspond to activity curves measured in the absence of NaCl for PRSS1 and in 20 mm NaCl for PRSS2. Autolytic bands resulting from cleavage of the Arg-122–Val-123 and Lys-193–Asp-194 peptide bonds are indicated. N-term, N-terminal fragment; C-term, C-terminal fragment. Cleavage sites were determined by N-terminal sequencing after transferring the bands to PVDF membranes. See “Experimental Procedures” for statement on experimental uncertainty and reproducibility.
