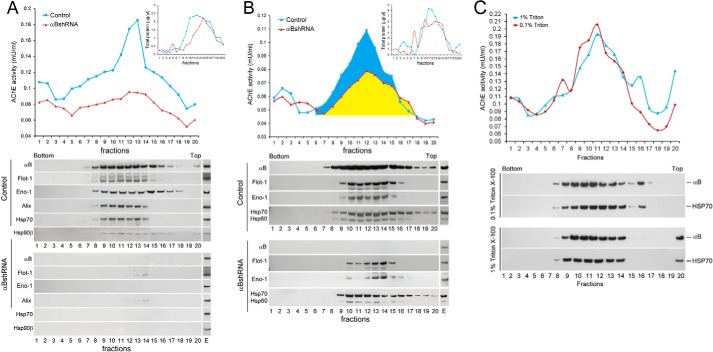
FIGURE 4.
Status of the synthesis of vesicles in αB-silenced ARPE cells. A, profile of AChE activity (top panel) and exosomal markers (bottom panels) in discontinuous sucrose density gradient of the culture medium from control (blue) and αB-silenced (red) ARPE cells. The AChE activity is appreciably reduced (red) and the exosomal markers αB, Flotillin 1 (Flot-1), Enolase 1 (Eno-1), Alix, Hsp70, and Hsp90β, as analyzed by immunoblotting are barely detectable (bottom panels), consistent with the absence of exosomes in the medium from αB-silenced cells (αBshRNA). B, discontinuous sucrose density gradient fractionation of cellular extracts. There is about 50% loss of AChE activity (compare blue and yellow area). Note the presence of exosomal markers (Flot-1, Eno-1, Hsp60, and Hsp70; anti-Alix and anti-Hsp90β were not used here) (bottom panels) in the fractions containing the AChE activity, suggesting continued synthesis of exosomes. E = native ARPE cellular extract (30 μg). Fractions 1 and 20 represent the bottom and the top of the gradient, respectively. Total protein profiles are presented as insets in the respective top panels. It is important to note that these cells were cultured in serum-free medium. C, this is a control gradient run with Triton X-100-treated medium from the native ARPE cells. Top panel shows profile of the AChE activity and the bottom two panels show immunoblots of fractions collected from each gradient. The samples were treated with Triton X-100 for 30 min at 4 °C (red, 0.1%, and blue, 1% Triton X-100) before loading on the gradient. Triton X-100 does not alter the AChE activity nor the immunoblot profiles markedly.

