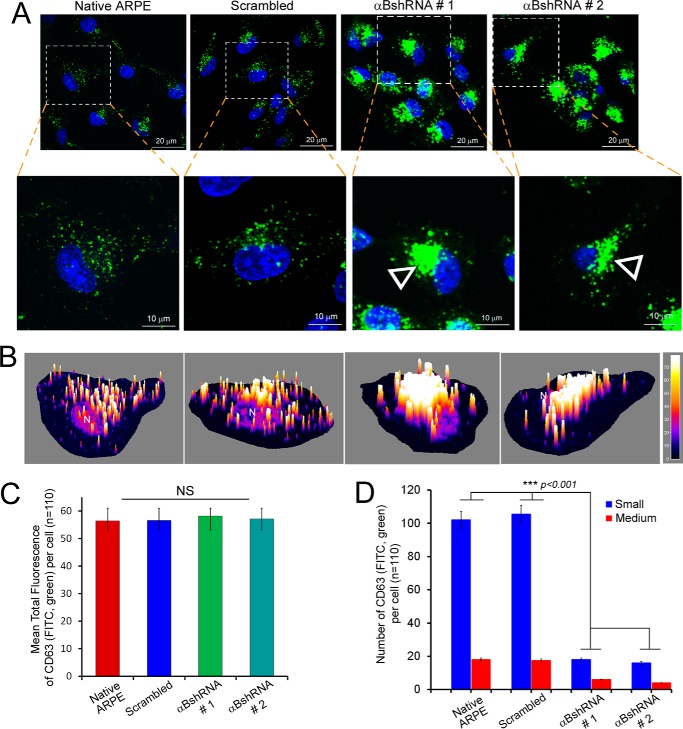
FIGURE 5.
Inhibition of αB expression leads to aggregated patterns of CD63 (LAMP3) distribution. A, confocal images of ARPE cells (z-sections) showing distribution of CD63(LAMP3) (FITC, green)-labeled vesicles. A magnified view of the corresponding individual z-slice (0.5 μm) from a single cell is shown on the bottom panel. Note that in native and scrambled control cells the CD63(LAMP3)-labeled vesicles are dispersed throughout the cytoplasm, while there is a peri-nuclear accumulation of these vesicles (open arrowheads) in αB-silenced cells (αB shRNA #1 and αB shRNA #2). B, three-dimensional surface plots of the z-slices magnified in A. C, quantitation of CD63(LAMP3) cellular fluorescence in the z-slices shown in A. Although the perinuclear accumulation of CD63(LAMP3) fluorescence in αB-inhibited cells (αB shRNA #1 and αB shRNA #2) appears increased, there is no significant difference in the total anti-CD63 fluorescence in all four groups of cells. D, quantitation of the number of vesicles. There is significant difference in the distribution of vesicles in the αB shRNA cells where the vesicles are largely stacked and are therefore not counted as single units as in the native ARPE and in scrambled control cells. Note that the vesicles were grouped as Small (≤120 nm) and Medium (≥121 nm); note that the data clearly indicate large changes in both categories because of the stacking and/or fusion in αB-silenced cells.

