FIGURE 6.
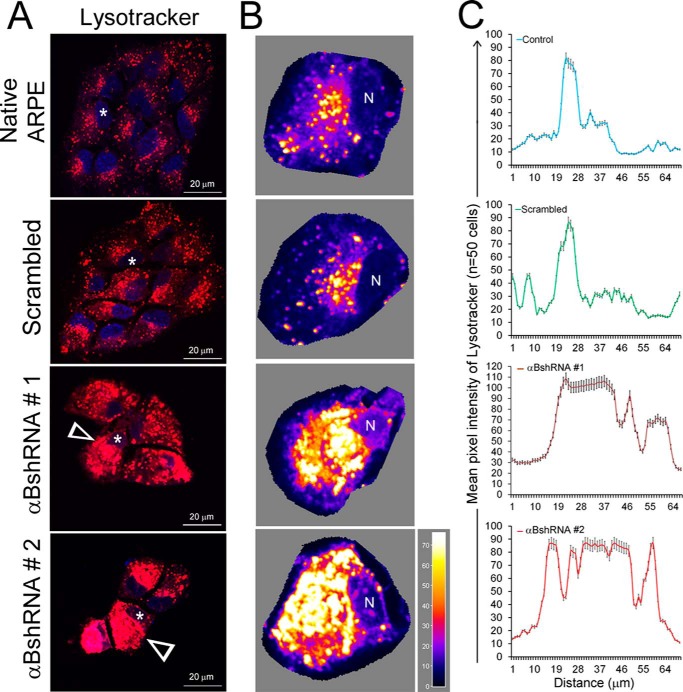
Inhibition of αB expression leads to altered patterns of lysosomal staining in αB-inhibited ARPE cells. A, live cell images of ARPE cells incubated in Lysotracker Red DND-99 (that stains the acidic organelles in red) show a dispersed pattern in native and scrambled control ARPE cells (upper two panels). However, in cells where αB expression is inhibited, clumped or aggregated staining is seen (αB shRNA #1 and αB shRNA #2, white arrowheads). B, three-dimensional surface plots of individual cells shown by asterisks in A. The images were oriented such that the cellular nucleus (N) was on the same side. The pseudocolor scale shows intensity. White, high; dark blue, low. C, quantitation of distribution of LysoTracker fluorescence in native (blue line), scrambled (green line), and αBshRNAs #1 and #2 (brown and red lines, respectively) ARPE cells using ImageJ plot profiles (mean pixel intensity is expressed ± S.E.). αB-silenced ARPE cells show multiple high mean peak pixel intensities across the cytoplasm indicating altered distribution of lysosomal components.

