
FIGURE 4.
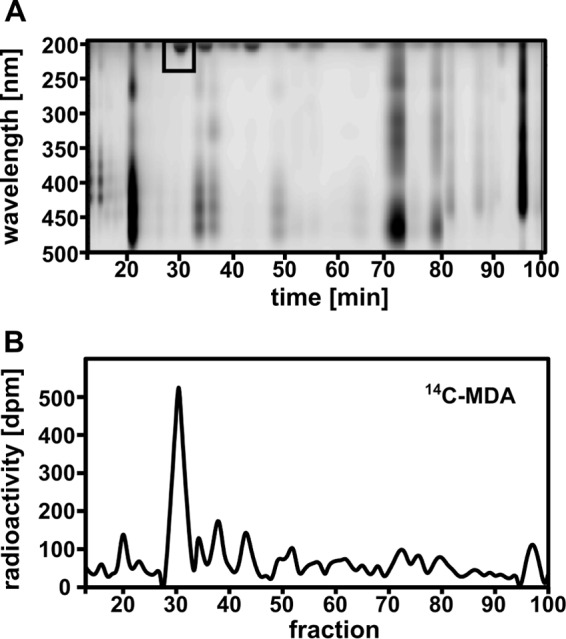
HPLC separation of lipid extracts from WT plants exposed to 14C-MDA for 24 h. A, chromatogram of polar leaf lipids monitored by light absorption (200–500 nm). B, radiation distribution in HPLC-fractions measured by liquid scintillation. (Pool of leaves from 4 plants, 300,000 dpm/plant l−1; SA: 0.67 nCi nmol−1).