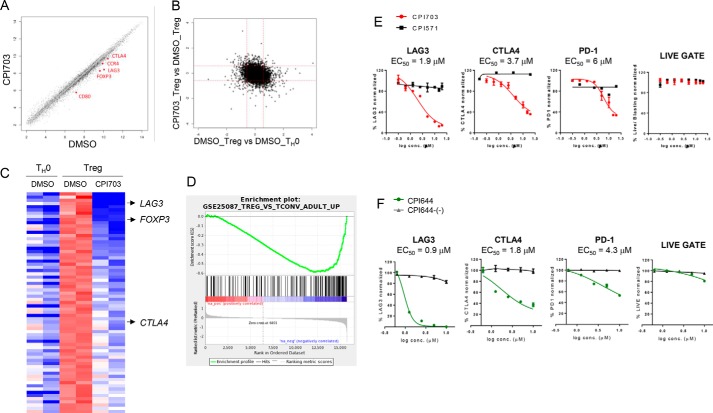
FIGURE 5.
CBP/EP300 bromodomain inhibition alters the human Treg transcriptional signature. A and B, human naïve T cells were cultured with anti-CD3/CD28 and TGF-β/IL-2 (Treg) or anti-CD3/CD28 alone (TH0) and incubated with DMSO or 4 μm CPI703 for 4 days, and whole genome gene expression was evaluated on the Affymetrix exon array platform. Each probe set is shown as a point in the scatter plot; log fold change calculated as difference between mean values of RMA expression levels for each condition. Probe sets are shown in black if a Student's t test on the two pairs of values shows a difference with p < 0.05; otherwise the points are in gray. C, probe sets in the heat map were sorted by fold-change of transcripts in Tregs when treated with CPI703. The top row corresponds to the probe set with the greatest loss of expression with CPI703. The deepest red and blue colors represent values of +0.5 or greater, and −1.5 or less, respectively. D, the complete list of annotated probe sets along with the difference of the average RMA expression values in Tregs with CPI703 treatment versus DMSO treatment was used as input to GSEA. Gene set GSE25087_TREG_VS_TCONV_ADULT_UP showed significant down-regulation in our data set. The enrichment score was −0.5891071; the normalized enrichment score and p values were −1.8608235, and 0.0, respectively (the p value was reported by the GSEA preranked analysis program as being 0.0, based on random permutations). E and F, flow cytometric analysis for the expression of the indicated markers on Tregs treated with CPI703 (and CPI571) (E) and CPI644 (and CPI644-(−)) (F). conc., concentration.

