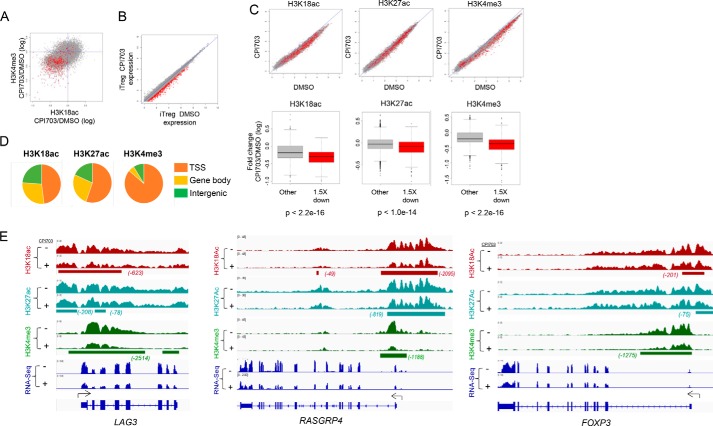
FIGURE 6.
CBP/EP300 bromodomain inhibition alters the chromatin state and reduces H3K18Ac and H3K27Ac at key target loci in human Tregs. A, each point in the scatter plot represents the regularized log2 fold change with treatment (CPI703 versus DMSO) of average ChIP-seq signal at a transcript start site for the given signal (H3K18ac on the x axis and H3K4me3 on the y axis). Points in red represent transcripts showing a loss of expression, as defined by a regularized log2 fold change of at least 1.5 down. B, each point in the scatter plot shows the regularized log expression level of one transcript for CPI703 versus DMSO treatment. Points in red represent transcripts showing a loss of expression, as defined by a regularized log2 fold change of at least 1.5 down. C, scatter plots in the top row show the effect of CPI703 versus DMSO on histone mark signals near TSSs. Each point is one TSS, and red points represent transcripts showing an expression loss of at least 1.5 in regularized log2 space. The box and whiskers plots in the bottom row summarize the change in regularized log2 histone mark ChIP-seq signal for down-regulated (red) and other (gray) transcripts; p values from Student's t test comparing mark changes for down-regulated versus other transcripts. D, fraction of ChIP-seq signal in different genomic regions. SICER version 1.1 was run to identify regions of occupancy. All SICER intervals within 1000 bp of a TSS were annotated as TSS. SICER intervals overlapping the gene body but not TSS were annotated as gene body binding. All other SICER intervals were annotated as intergenic. Total SICER-reported signal in the intervals was summed for each category and summarized in this figure. E, visualization in IGV of ChIP-seq signal at the LAG3, RASGRP4, and FOXP3 loci. Intervals of differential occupancy are shown beneath each pair of treated and control tracks.

