
FIGURE 4.
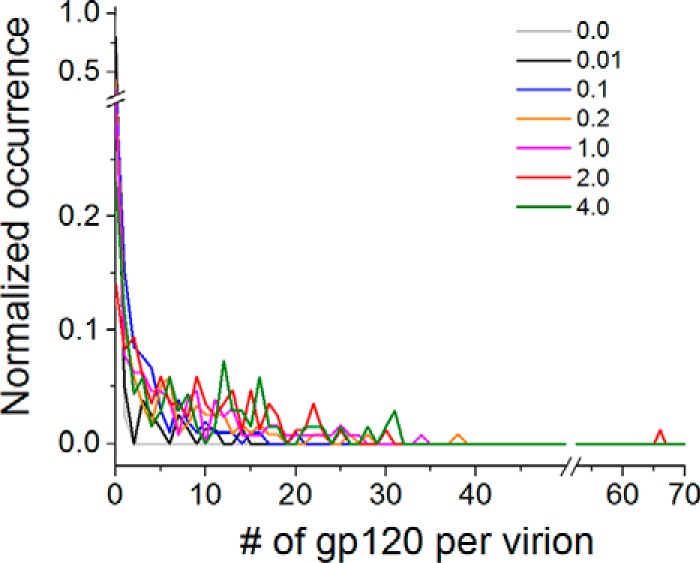
Histograms for the number (#) of gp120 molecules per virion determined from OTV. The histograms, with gray, black, blue, orange, purple, red, and green curves are for virions from 0 (n = 80), 0.01 (n = 79), 0.1 (n = 105), 0.2 (n = 119), 1.0 (n = 129), 2.0 (n = 85) and 4.0 μg of pEnv (n = 69), respectively.