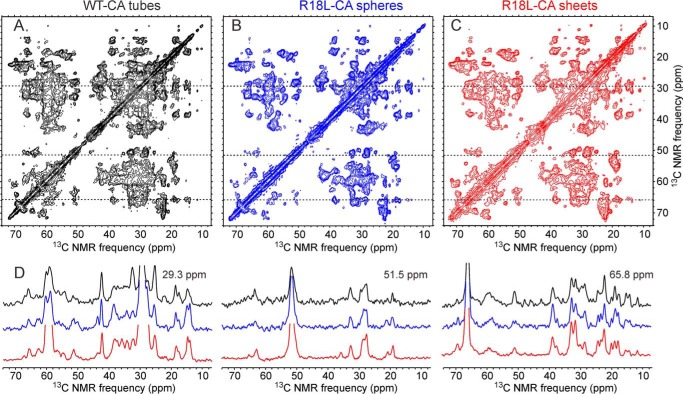
FIGURE 3.
Two-dimensional 13C-13C solid state NMR spectra of uniformly 15N,13C-labeled HIV-1 capsid protein assemblies. A, U-WT-CA tubes. B, U-R18L-CA spheres. C, U-R18L-CA sheets. D, one-dimensional slices at 29.3, 51.5, and 65.8 ppm (dashed lines in two-dimensional spectra). The one-dimensional slices are color-coded to match the two-dimensional spectra. DARR mixing periods between t1 and t2 periods were 100 ms for U-WT-CA tubes and 25 ms for U-R18L-CA spheres and sheets. Maximum t1 periods were 5.0–8.9 ms. Total measurement times were ∼18 h. Contour levels increase by factors of 1.5.

