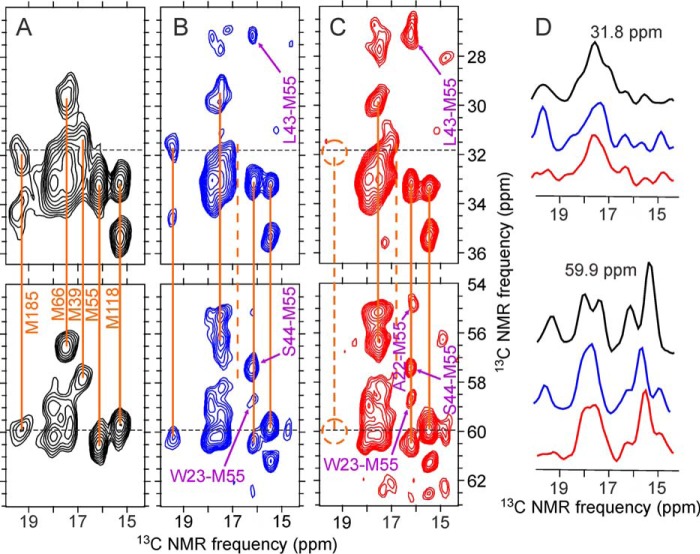
FIGURE 9.
Selected regions of two-dimensional 13C-13C spectra of HIV-1 capsid protein assemblies in which methionine residues are uniformly 15N,13C labeled. A, Met-WT-CA tubes. B, 2-Glyc,Met-R18L-CA spheres. C, 2-Glyc,Met-R18L-CA sheets. Orange lines indicate intra-residue correlations to methionine methyl signals. The dashed line in panel C indicates the absence of signals from Met185. Inter-residue cross-peaks in two-dimensional spectra of 2-Glyc,Met-R18L-CA assemblies, which were also partially 13C labeled at non-methionine residues by expression with [2-13C]glycerol as the carbon source, are indicated by purple labels and arrows. D, color-coded one-dimensional slices at 31.8 and 59.9 ppm (dashed lines in two-dimensional spectra). Spectra were recorded with 500-ms DARR mixing periods and maximum t1 periods of 6.9 ms. Contour levels increase by factors of 1.2.

