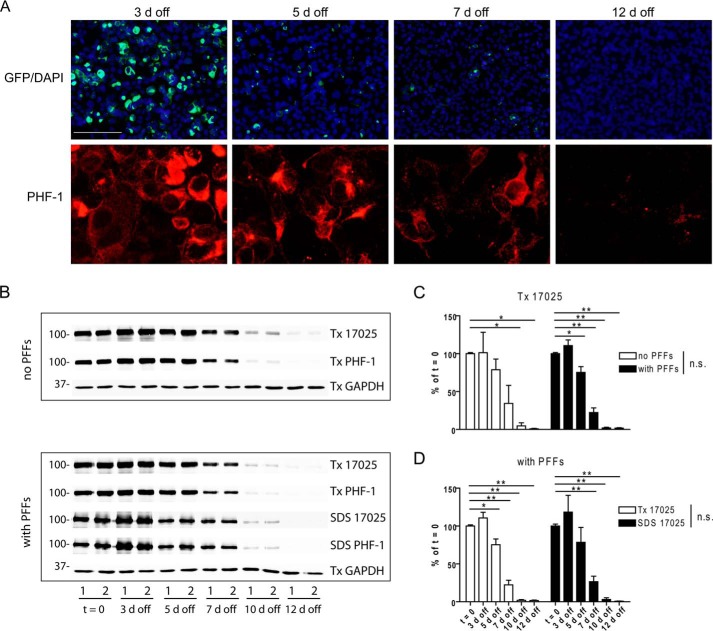
FIGURE 3.
Clearance of tau aggregates in tau PFF-transduced clone 4 cells following suppression of soluble tau expression. A, Triton-insoluble tau aggregates were shown at different time points after tau PFF-transduced clone 4 cells were cultured on Dox-free medium (3 to 12 days off Dox). Soluble proteins were removed by 1% Triton X-100 extraction during fixing. Scale bar: 200 μm for GFP; 50 μm for PHF-1. B, clone 4 cells with or without tau PFF transduction were sequentially extracted by 1% Triton X-100 lysis buffer (Tx) followed by 2% SDS lysis buffer (SDS) after different off Dox durations and immunoblotted with 17025 and PHF-1. Only the Triton X-100 fraction was shown for cells without tau PFF transduction as these cells do not contain Triton X-100-insoluble tau (see Fig. 1A). GAPDH served as a loading control; “t = 0” refers to the time point right before Dox removal. Samples from duplicate wells of a representative set of experiments were shown as 1 and 2. C and D, densitometry quantifications of 17025 immunoblots for experiments shown in B. Independent sets of experiments used for quantification: n = 2 for “no PFFs” cells; n = 4 for “with PFFs” cells, but only 2 sets of experiments had 10-day off time points, and 3 sets had 12-day off time points. Measurements were normalized to t = 0 samples in each set and shown as mean ± S.E. C compares clearance of Triton X-100-soluble tau in cells with and without tau PFF transduction, whereas D compares clearance of Triton X-100-soluble and -insoluble (i.e. SDS-soluble) tau in cells with PFF transduction. For both C and D, two-way ANOVA showed a significant effect of time on tau levels (p < 0.0001) but a non-significant difference between no PFFs and with PFFs cells or between Triton X-100-soluble and -insoluble tau in PFF-transduced cells. Dunnett's post hoc test was performed for pairwise comparisons between t = 0 and each of the other time points, with significant differences marked in the graphs. *, p < 0.05. **, p < 0.01. Quantification of PHF-1 blots revealed similar trends (data not shown). n.s., non-significant.

