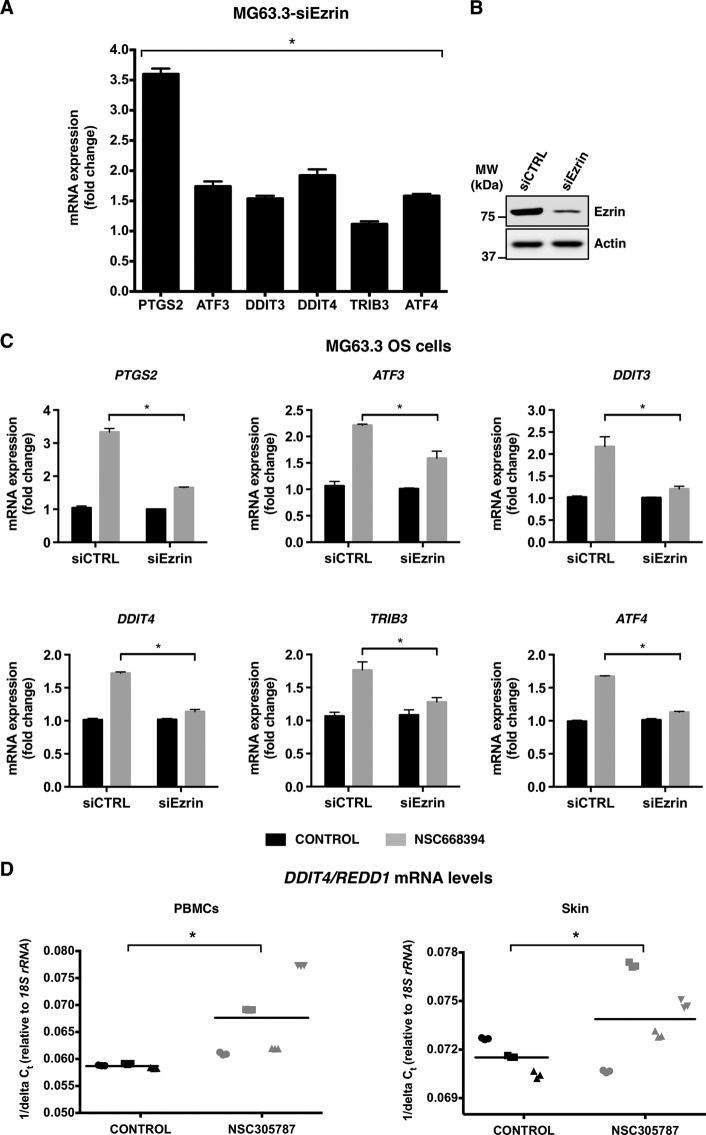
FIGURE 6.
Suppression of ezrin expression leads to increased mRNA levels of downstream integrated stress response signaling effector genes and results in loss of transcriptional response to anti-ezrin compound. A, expression of ezrin protein was inhibited by siRNA targeting ezrin in human MG63.3 osteosarcoma cells and mRNA levels of a set of selected integrated stress response signature genes including PTGS2, ATF3, DDIT3, DDIT4, TRIB3, and ATF4 were measured by real time qPCR. The results were normalized to 18S rRNA levels and expressed as fold change over the control. The values are presented as the means and standard deviations of triplicate determinations (*, p < 0.05, compared with siControl; using an unpaired Student's t test). B, Western blot showing ezrin levels from A. The protein levels were detected from total cell lysates at 72 h after transfection of cells with siRNA for ezrin. MW, molecular mass. C, ezrin expression was inhibited by a siRNA in MG63.3 cells, and cells were treated with either 3.0 μmol/liter of NSC668394 or vehicle control for 6 h on the third day of transfection. The mRNA levels of PTGS2, ATF3, DDIT3, DDIT4, TRIB3, and ATF4 were measured by real time qPCR. The results were normalized to 18S rRNA levels and expressed as fold change over the vehicle control in both control siRNA and ezrin siRNA-transfected cells. The values are presented as the means and standard deviations of triplicate determinations (*, p < 0.05, compared with siControl; using an unpaired Student's t test). D, DDIT4/REDD1 gene may serve as a pharmacodynamic marker of response to ezrin inhibition by NSC305787 in vivo. DDIT4/REDD1 mRNA levels of PBMCs and skin were measured by real time qPCR after a short term i.p. treatment of CD-1 mice with NSC305787 at a dose of 240 μg/kg once daily for 3 consecutive days. The results were normalized to 18S rRNA levels and expressed as 1/ΔCt. Each sample was analyzed in triplicate, and each mouse in treatment and control group is designated by a specific symbol. Horizontal lines indicate mean values of all measurements in each group (*, p < 0.05, compared with control; using an unpaired Student's t test).

