FIGURE 5.
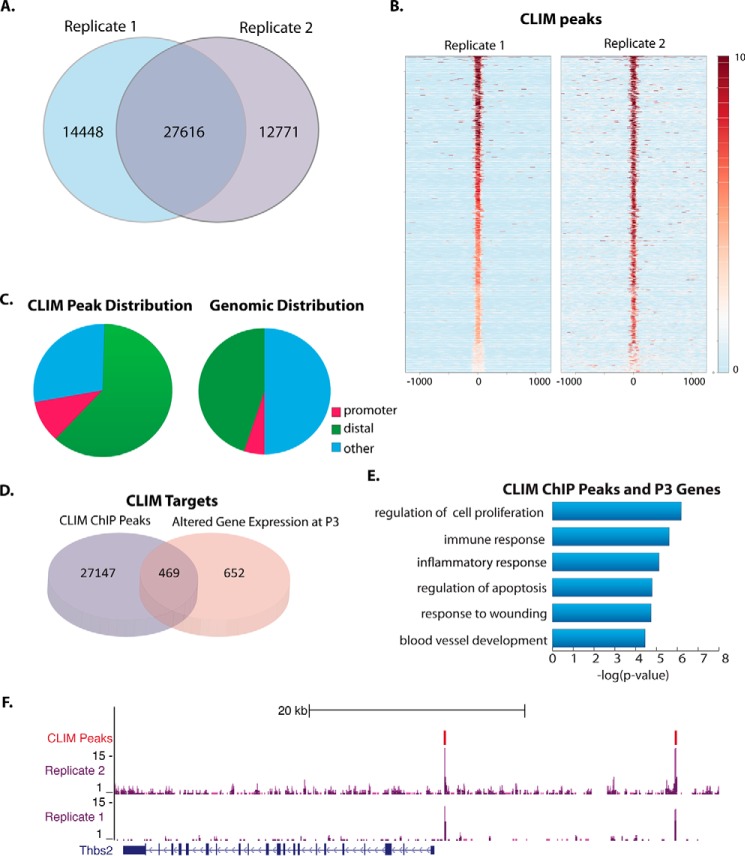
ChIP-Seq identifies direct targets of CLIMs in corneal epithelium. A, overlap of ChIP-Seq peaks from each Myc tag ChIP replicate. B, plot of density of ChIP-Seq reads from each replicate centered on CLIM peaks from replicate 2. The scale shows the intensity of ChIP-Seq reads within the selected regions. C, distribution of ChIP-Seq peaks across genomic features: promoter, 0–2-kb window upstream of TSS; distal, 50 kb upstream of TSS through 5 kb downstream of TSS. D, overlap of ChIP-Seq peaks and genes affected by DN-CLIM in P3 corneas. E, GO analysis of genes affected by DN-CLIM at P3 that have a CLIM peak within 40 kb. F, CLIM peaks in the upstream region of thrombospondin 2 (Thbs2). GEO accession number, GSE49409.

