FIGURE 6.
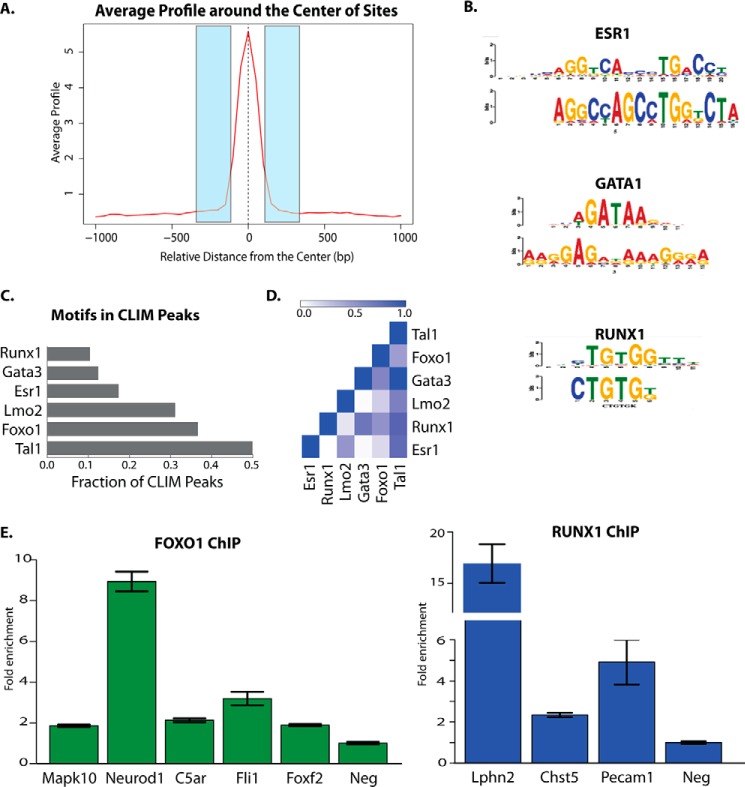
ChIP-Seq identifies CLIM-associated DNA-binding proteins in corneal epithelium. A, schematic of regions flanking CLIM peaks used for motif analysis. B, enriched motifs found by MEME in regions flanking peaks. C, enriched motifs found in flanking 250 bp of ChIP-Seq peaks by directed motif searches. D, co-occurrence of motifs found in CLIM peaks. E, ChIP-qPCR for FOXO1 and RUNX1 binding to their predicted DNA-binding motifs within selected CLIM ChIP-Seq peaks. Error bars represent S.E. Neg, negative control region.

