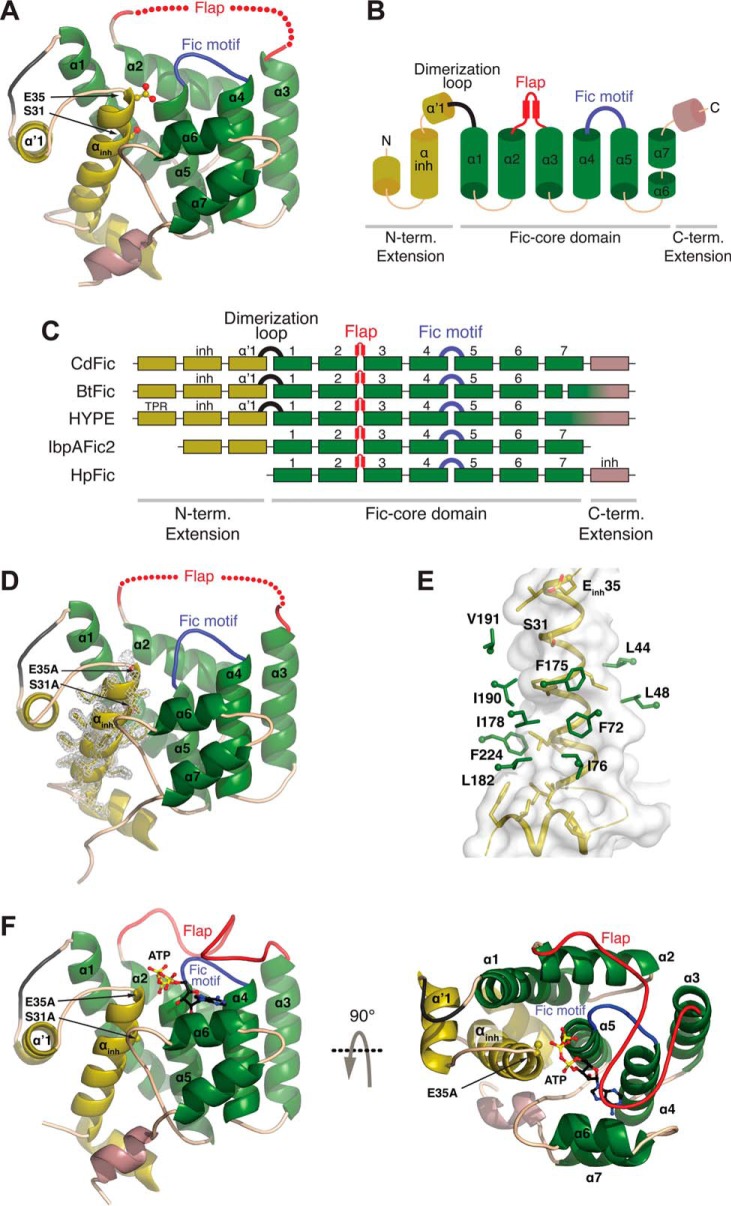
FIGURE 1.
CdFic crystal structures. A, the crystal structure of CdFic. The Fic domain core is shown in green, the N-terminal (N-term.) extension including the αinh is in dark yellow, the C-terminal (C-term.) extension is in violet, the conserved Fic motif loop is in blue, the dimerization loop is in black, and the position of the disordered flap is schematically shown with red spheres. Secondary structures in all other panels are colored accordingly. The αinh residues Ser-31 and Gluinh-35 are represented with sticks and highlighted by arrows. B, topological diagram based on the CdFic structure. C, structural superposition of Fic crystal structures represented with secondary structure and shown as a schematic diagram with each box representing a helix (B. thetaiotaomicron; Protein Data Bank code 3CUC), HYPE (Homo sapiens; Protein Data Bank code 4U07), IbpAFic2 (H. somni; Protein Data Bank code 4ITR), and HpFic (H. pylori; Protein Data Bank code 2F6S). The position of αinh is labeled inh, and TPR is the tetratricopeptide repeat motif of HYPE. D, crystal structure of CdFicSE/AA. The inhibitory motif substitutions S31A and Einh35A are represented with sticks and highlighted by arrows. The electron density for αinh is shown in gray. E, the interaction surface between the αinh helix (dark yellow) and residues in the CdFic core (green) with the αinh surface envelope colored in gray. F, crystal structure of the CdFicSE/AA-ATP complex shown in two orientations related by a 90° rotation about the horizontal axis. ATP is represented with black, blue, red, and yellow sticks, and the ordered/closed flap is colored in red.

