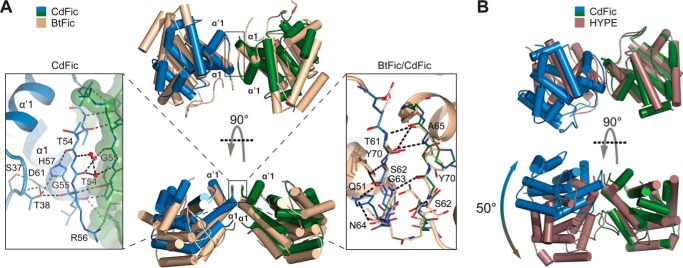
FIGURE 3.
The dimerization interface. A, superposition of CdFic (monomers are depicted in blue and green) with BtFic (B. thetaiotaomicron; Protein Data Bank code 3CUC) (light brown). The structures are shown in two orientations related by a 90° rotation about the horizontal axis. The left inset shows a close-up view of the CdFic interface with the surface envelope of one monomer shown in green color. The right inset shows the superposition of the CdFic and BtFic interfaces with BtFic shown in light brown color. Only hydrogen bonds from BtFic are shown for clarity using black dashed lines. Both interfaces are symmetric; however, in both insets not all symmetry-related hydrogen bonds are shown for clarity. B, superposition of CdFic dimer (blue and green) against HYPE dimer (H. sapiens; Protein Data Bank code 4U0S) (dark brown). The related but considerably twisted interface of HYPE results in a large overall rotation between its monomers compared with those of CdFic as calculated by DynDom (57).

