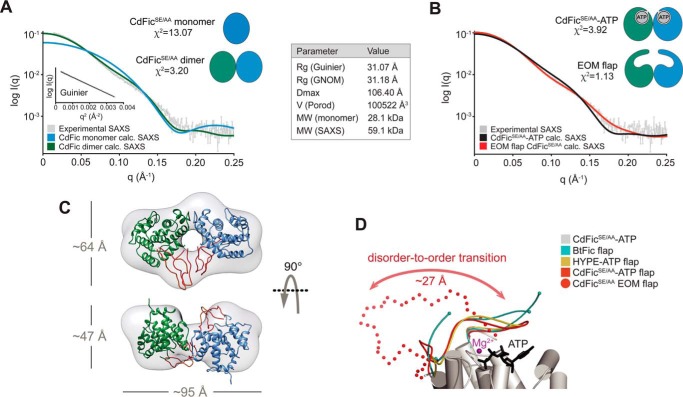
FIGURE 4.
SAXS analysis. A, CdFicSE/AA SAXS scattering curve is shown in gray as relative log(intensity) versus inverse scattering angle. The Guinier plot (log I(q) versus q2) and a table with general SAXS parameters are both shown as insets. MW (monomer) is the mass calculated from the sequence, whereas MW (SAXS) is the mass estimated using the Porod volume. CRYSOL (42) fits between experimental SAXS data and the theoretical/calculated scattering profile are shown as colored curves. The fit to the CdFicSE/AA monomer is shown as a blue curve, whereas the fit to the CdFicSE/AA dimer is shown as a green curve. The resulting χ values (χ2) are shown next to the schematic models. B, the same experimental CdFicSE/AA SAXS scattering curve as in A is shown in gray color. The CRYSOL fit to the theoretical/calculated scattering profile of the CdFicSE/AA-ATP dimer structure including an ordered/closed flap is shown as a black curve. The CRYSOL fit to the CdFic dimer structure including the EOM (46, 47)-generated model of the flap is shown as a red curve. C, the three-dimensional shape reconstruction of the ab initio envelope calculated by DAMMIF using P2 symmetry is shown in transparent gray color. The CdFicSE/AA dimer structure with the two monomers shown in green and blue, respectively, is docked in the SAXS envelope. The EOM-generated reconstructions of the flexible flap are colored in red. D, the CdFicSE/AA-ATP crystal structure representing the closed/ordered conformation (red solid line) is aligned against the EOM-computed flap representing the open/flexible conformation (red spheres) with only one of the two EOM models shown for clarity. Superpositions of the BtFic (B. thetaiotaomicron) and the HYPE (H. sapiens) flaps are shown in cyan and yellow, respectively.

