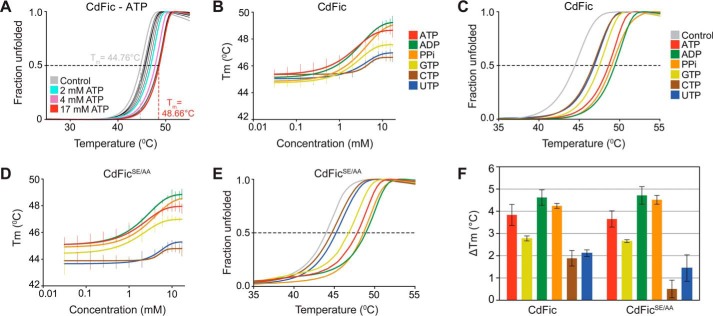
FIGURE 5.
Cofactor binding. A, CdFic DSF melting curves showing fraction of unfolded protein versus temperature, averaged from triplicate measurements. Each curve represents a measurement at various ATP concentrations ranging from 0 to 17 mm. For clarity, four different melting curves are highlighted: control (CdFic alone) in gray; 2 mm in cyan; 4 mm in purple, and 17 mm in red. Melting curves for the other ligand concentrations are shown in black. The black dashed line at 0.5 unfolded fraction highlights the points where Tm is extrapolated. The gray and red dashed lines represent the Tm determination for the CdFic control lacking the ligand and the highest ATP concentration (17 mm), respectively. B, the sigmoidal curves represent the plot of the CdFic Tm values as a function of indicated ligand concentration. The vertical lines represent the standard deviation from triplicate measurements. C, DSF melting curve of CdFic averaged from triplicate measurements at 17 mm concentration of ATP, ADP, PPi, GTP, CTP, and UTP. D and E, identical assay and color scheme as for B and C but using the CdFicSE/AA mutant. F, ΔTm values for both CdFic and CdFicSE/AA plotted as bars with ligands colored according to B–E. Error bars represent S.E.

