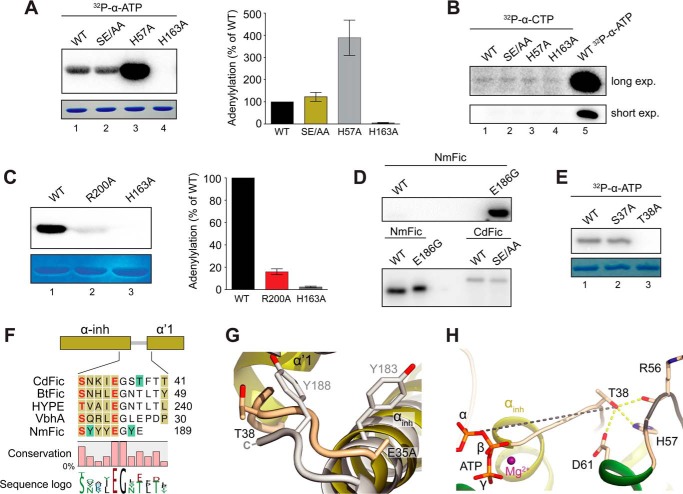
FIGURE 6.
Autoadenylylation activity and the acceptor site. A, in vitro autoadenylylation assay. Wild type (WT) CdFic (lane 1), CdFicSE/AA inhibitory motif mutant (lane 2), CdFicH57A dimerization interface mutant (lane 3), and CdFicH163A Fic motif active site mutant as a negative control (lane 4). Proteins were Coomassie-stained (lower panel), dried, exposed on a phosphor screen (top panel), and quantified (right panel). The indicated error bars represent the standard deviation from four independent experiments. B, in vitro autoadenylylation assay as in A but using [α-32P]CTP and longer exposure (exp.) time. C, in vitro autoadenylylation assay with CdFicR200A (lane 2). CdFic is shown (lane 1) along with the CdFicH163A negative control (lane 3). Quantification is shown to the right with the indicated error bars representing the standard deviation from three independent experiments. D, the activity of CdFic and CdFicSE/AA in comparison with the activity of NmFic and NmFicE186G from N. meningitidis. Upper image, equal amounts of NmFic and NmFicE186G (50 ng) exposed for 30 min. Lower image, NmFic (65 ng), NmFicE186G (0.1 ng), and both CdFic and CdFicSE/AA (195 ng) exposed for 43 h. E, in vitro autoadenylylation assay with CdFicS37A and CdFicT38A using [α-32P]ATP. F, structurally based multiple sequence alignment of CdFic, BtFic (B. thetaiotaomicron), HYPE (H. sapiens), VbhA (B. schoenbuchensis), and NmFic. The mapped acceptor sites are colored with green boxes, and the inhibitory residues Glu/Ser of the inhibitory motif are colored in red. The αinh as well as the α′1 helix are both shown in dark yellow color as part of the N-terminal extension to the CdFic core. The fractional conservation is represented below the alignment using bars and sequence conservation with sequence logo. G, superposition of CdFic and NmFic acceptor sites with CdFic colored in dark yellow according to E and NmFic colored in gray. H, the autoadenylylation acceptor site Thr-38 interactions with the dimerization loop colored in black as well as the distance to the ATP α-phosphate shown with a gray dashed line. Hydrogen bonds are shown with yellow dashed lines.

