FIGURE 6.
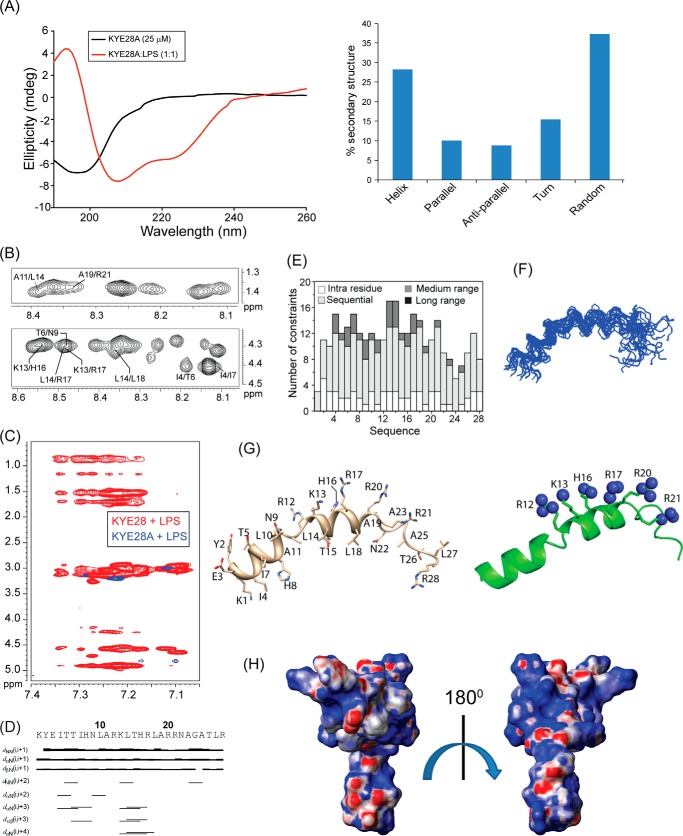
Structural characterization of KYE28A in LPS. A, CD spectra of KYE28A alone and in LPS, showing adoption of an α-helical pattern of KYE28A upon addition of LPS (left panel). A bar plot showing the content of secondary structure of KYE28A in LPS obtained from deconvolution of the CD spectra using CDNN software is also included (right panel). B, different regions of the trNOESY spectra of KYE28A in LPS showing important medium- and long-range NOE contacts. The experiments were performed using Bruker Avance III 700 MHz NMR spectrometer (150 ms NOESY mixing time and at 25 °C). C, an overlay of the aromatic region of the trNOESY spectra of KYE28 (red) and KYE28A (blue) in E. coli 0111:B4 LPS showing a complete loss of NOEs in case of KYE28A. D, bar diagram showing sequential and medium-range NOEs of KYE28A in LPS. The bar thickness indicates the peak intensity assigned as strong, medium, and weak. E, histogram depicting the number of trNOEs of KYE28A in LPS with respect to residue numbers. F, an ensemble of KYE28A in LPS showing the superposition of the backbone atoms (N, Cα, and C′) of the 20 lowest energy structures calculated using CYANA (PDB acquisition code 2NAU). G, representative schematic structure of KYE28A in LPS showing the orientation of the positive charges (sphere representation) over one side of the helical segment (left panel) maintaining a specific pattern dictated by 12RXXXH16XXXR20 or 13KXXXR17XXXR21 motif, signifying interaction with negatively charged monophosphate and diphosphate groups of LPS through either electrostatic interaction or hydrogen bonding. The hydrophobic residues remain oriented toward the other end maintaining an amphipathic orientation (left panel). H, electrostatic surface potential of KYE28A in LPS micelles in two different orientations at an angle of 180° to each other showing the surface distribution of charges.

