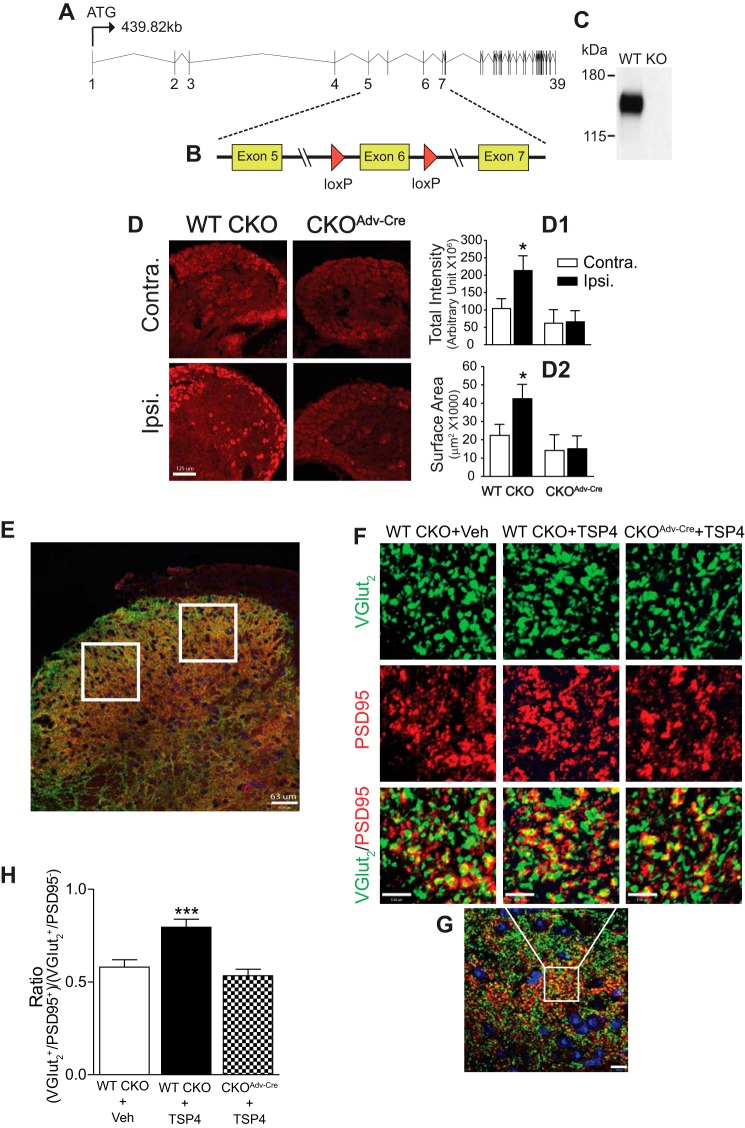
FIGURE 4.
Cavα2δ1 ablation from Advillin+ DRG neurons blocked TSP4-induced excitatory synaptogenesis. A, Cavα2δ1 gene structure. B, a strategy diagram of generating the Cavα2δ1 conditional knock-out mice. C, a representative Western blot (from n = 3) showing null Cavα2δ1 expression (KO) in brain lysates from homozygous Cavα2δ1 KO mice crossed with germ line Cre mice (FVB/N-Tg(ACTB-cre)2Mrt/J (The Jackson Laboratory). D, validation of Cavα2δ1 conditional knock-out from Advillin-Cre expressing DRG neurons in 2-week SNL WT CKO control or CKOAdv-Cre mice with Cavα2δ1 antibody immunofluorescent staining (red). Contra., non-injury; Ipsi., injury side. Summarized total intensity (D1) and surface area (D2) data are presented as the means ± S.E. from 12 sections, three mice in each group. *, p < 0.05 compared with non-injury (contra.) side in each group with paired Student's t test. Scale bar: 125 μm for all panels. E, a representative L4 dorsal spinal cord image showing random sampling (white squares) of fluorescent immunoreactivity from superficial dorsal horn for data analysis. Scale bar: 63 μm. F, representative images from co-immunostaining in thin sections of L4 dorsal spinal cord from WT CKO or CKOAdv-Cre mice 4-days post-i.t. saline (vehicle) or TSP4 (5 μg/5 μl/mouse) injection. VGlut2 (green), excitatory presynaptic marker; PSD95 (red), post-synaptic marker; yellow, colocalized immunoreactivity. Scale bar: 5 μm for all panels. Each of these images was enlarged to show detailed structure from a small area (similar to the white box in G) of a sampling image. G, a representative sampling image showing the area (in the white box) that was enlarged to show detailed structure above. Scale bar: 10 μm. H, summarized ratio of VGlut2+/PSD95+ over VGlut2+/PSD95− immunoreactive puncta. Data are the means ± S.E., 36 sections from 3 mice each. ***, p < 0.001 versus vehicle injected WT CKO mice by one-way ANOVA with Dunnett's post hoc test.

