FIGURE 2.
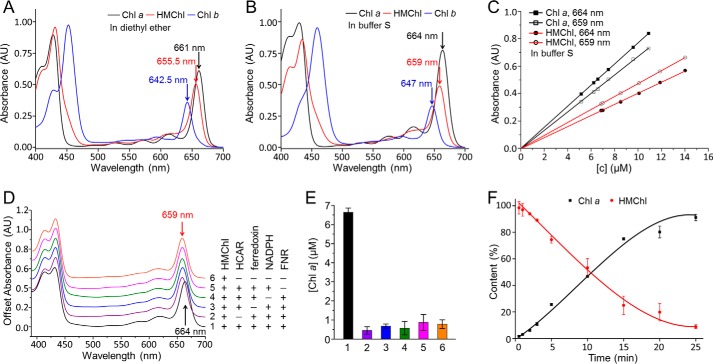
Establishment of a quantitative activity assay for HCAR. A and B, spectral comparison of purified chlorophylls in diethyl ether (A) and in buffer S (B). C, the calibration line of absorbance versus concentration of chlorophyll a and HMChl in buffer S. The same standard series of chlorophyll a or HMChl were measured at 664 and 659 nm. The extinction coefficient is derived from the slope by the least squares method. D, the absorption spectra of six in vitro HCAR activity experiments. The presence or absence of a component (50 μm HMChl, 15 μm HCAR, 10 μm ferredoxin, 1 mm NADPH, 10 μm FNR) is indicated by + or −, respectively. The reaction was stopped with four parts acetone, and then the liquid phase was spectroscopically monitored. E, product contents of the six experiments after the 15-min reaction. The experiment order is same as that in D, and the same color scheme is used. The contents of chlorophyll a are calculated from the absorbance value at 659 and 664 nm. The error bars represent the S.D. from three independent experiments. F, progress curve of the HCAR-catalyzed reaction. The reaction with approximate 3-fold excess of HMChl was prepared as in experiment 1 in D, and three replicates were conducted. The contents of HMChl and chlorophyll a are calculated from the absorbance value at 659 and 664 nm. Chl, chlorophyll.

