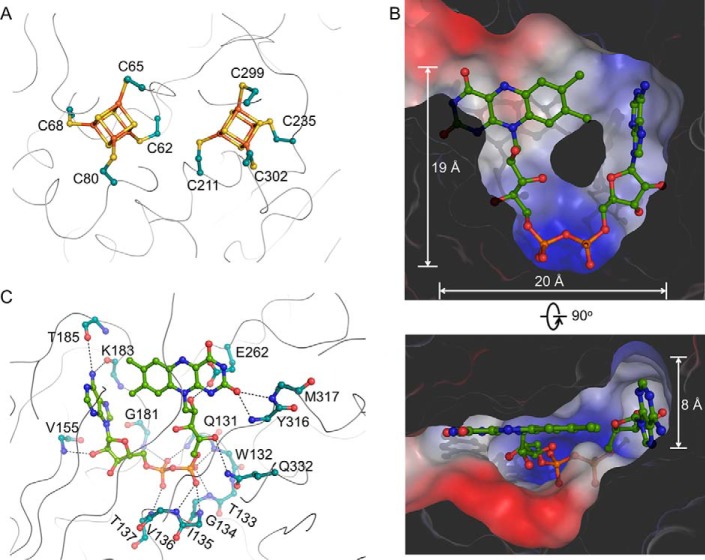
FIGURE 4.
Cofactor interactions. A, details of the two [4Fe-4S] cluster-binding sites. B, the FAD-binding pocket. The surface of HCAR is colored according to the electrostatic potential. C, the environment of the FAD cofactor (green sticks). The side chain atoms of residues whose backbone atoms participate in FAD binding are not shown.

