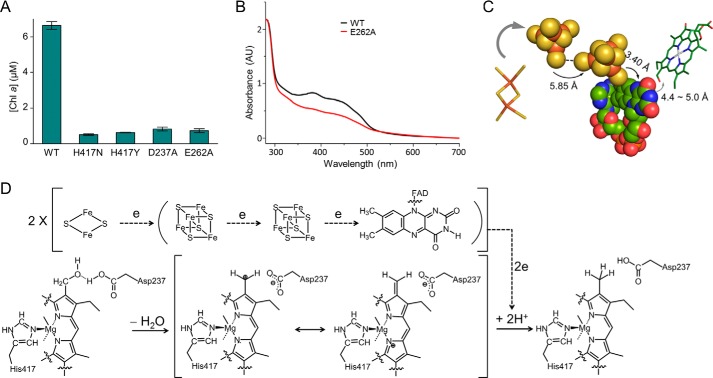
FIGURE 7.
Catalytic mechanism. A, assays for the critical residues involved in HCAR catalysis. The data are presented as the means ± S.D. of three independent experiments. B, spectra of HCAR proteins. E262A mutant protein has decreased absorbance between 300 and 500 nm, consistent with the fact that it contains less cofactor than the wild type HCAR. C, electron transfer pathway. The [4Fe-4S] clusters and FAD are shown in sphere model. The [2Fe-2S] cluster of Fd and the substrate HMChlide are shown as sticks. The distances between each element are indicated. D, proposed catalytic mechanism of HCAR. Dashed lines show the electron flow path from [2Fe-2S] cluster of ferredoxin to substrate via two [4Fe-4S] clusters and FAD.

