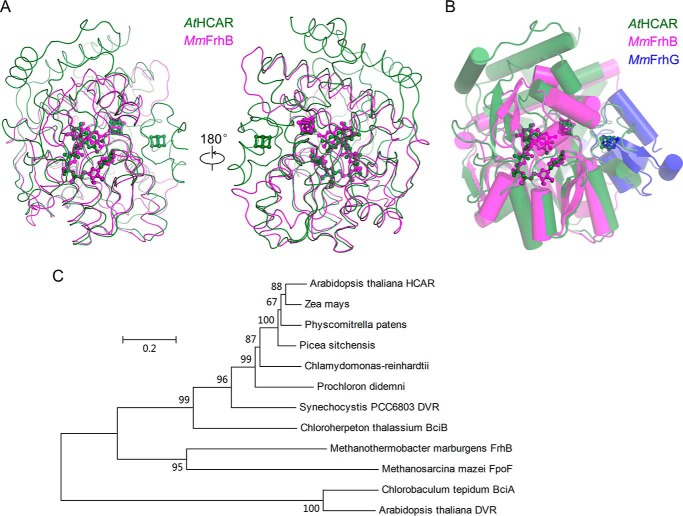
FIGURE 8.
HCAR homologues and evolution. A, superimposition of HCAR with FrhB from M. marburgensis. The backbone is shown in tube representation, and the cofactors are in ball-and-stick model. B, superimposition of HCAR with FrhB and FrhG from M. marburgensis. Each molecule is color-coded. C, phylogenetic tree of HCAR homologues. Chlorobaculum tepidum BciA and A. thaliana DVR are listed as outgroup.

