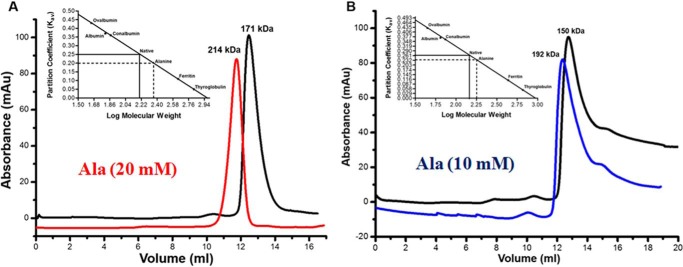
FIGURE 8.
Analytical gel filtration profiles of MtbAldR carried out under different conditions. The protein concentration used in A was 2 mg/ml, and the profile of the apoprotein is shown in black. The profile of the protein in the presence of 20 mm alanine is shown in red. The elution profiles in B correspond to the experiment involving protein at a concentration of 1 mg/ml. The blue curve corresponds to MtbAldR in the presence of 10 mm alanine. The inset in both panels shows the plot between the partition coefficient (Kav) and log of molecular weight for standard proteins of known molecular weight. This was carried out to calibrate the column. The Kav of the eluted species was calculated and extrapolated in the same plot to determine the log of molecular weight. The anti-log value was calculated to determine the actual molecular weight of the eluted species and is indicated above the curves. The results suggest that MtbAldR apparently adopts a higher order oligomeric form in the presence of alanine. Alternatively, we have hypothesized (see “Discussion”) that the protein forms an open quaternary structure in the presence of alanine, leading to a larger particle size and faster column elution.

