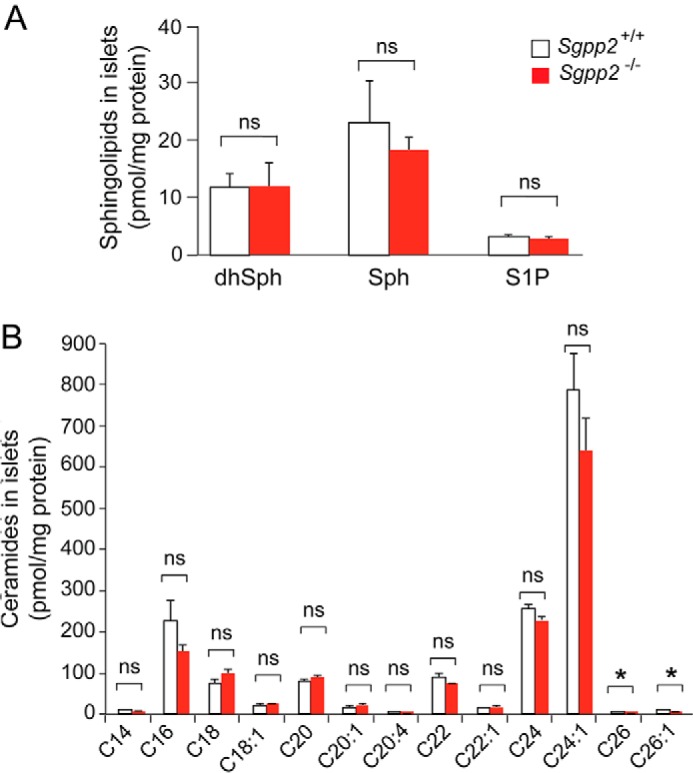
FIGURE 8.

Sphingolipid profile of Sgpp2+/+ and Sgpp2−/− mouse islets. The sphingolipid profile was determined by HPLC-tandem MS on three pooled islet samples, each obtained from Sgpp2+/+ and Sgpp2−/− mice. Each pool contained the islets isolated from 10 mice. Levels of dihydrosphingosine (dhSph), sphingosine (Sph), and S1P (A) and of individual ceramide species with different fatty acid chain lengths (B) were determined. Bars, mean ± S.D. (error bars); Student's t test; n = 3 for each genotype. *, p < 0.05; ns, not significant.
