FIGURE 7.
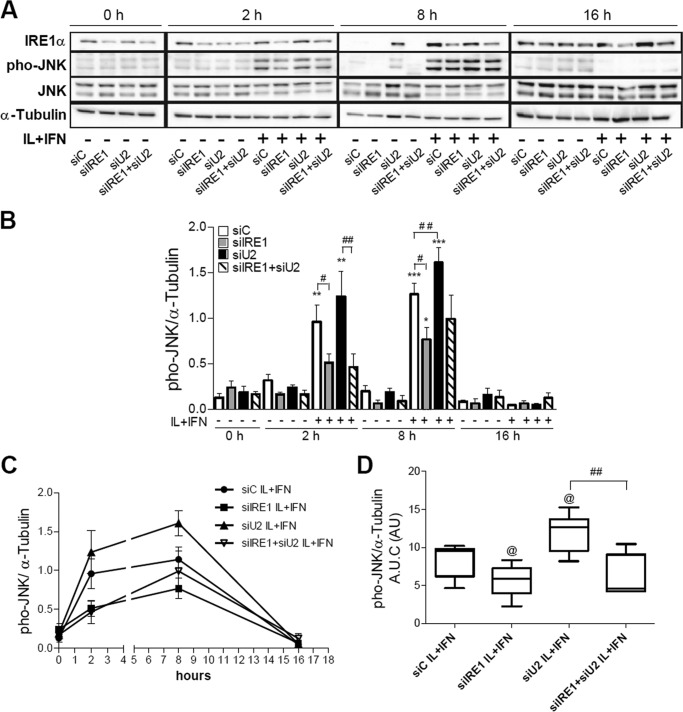
Effect of UBD on JNK phosphorylation is IRE1α-dependent. INS-1E cells were transfected with siControl (siC), siIRE1α (siIRE1), siUBD (siU2) or co-transfected with siIRE1 + siU2. 48 h later, cells were incubated with IL-1β + IFN-γ (IL+IFN) and analyzed by Western blot with phospho-JNK (phoJNK), total JNK, and IRE1α antibodies at the indicated time points. One representative Western blot of five independent experiments (A) and the means ± S.E. of the optical density measurements of the Western blots (B) are shown. α-Tubulin expression was used as loading control. The means ± S.E. of JNK expression in cytokine-treated cells are shown in C, and the quantitative analysis of the area under the curves (A.U.C.) is shown in D. *, p < 0.05; **, p < 0.01; and ***, p < 0.001 versus siC untreated; @, p < 0.05 versus siC IL + IFN; #, p < 0.05, and ##, p < 0.01 as indicated by bars; one-way ANOVA followed by Student's paired t test with Bonferroni correction.

