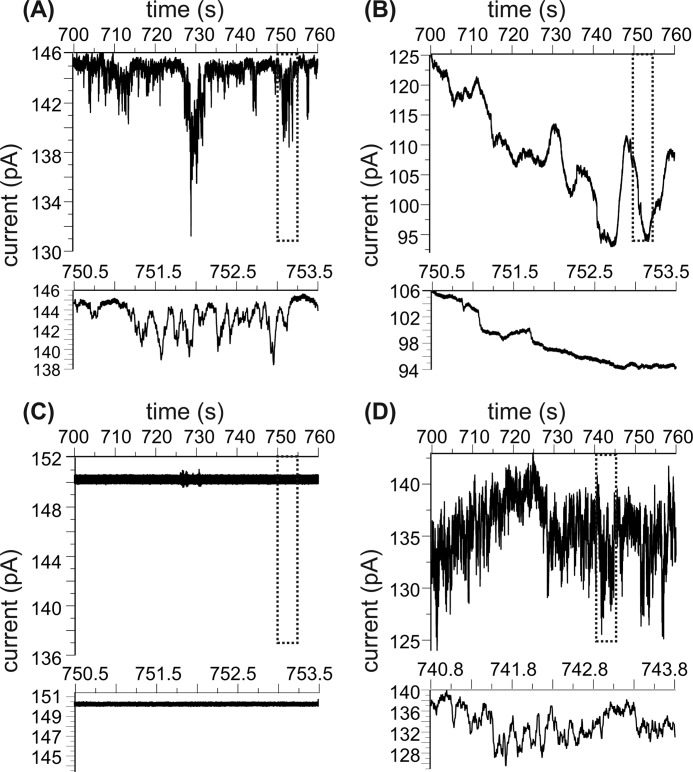
FIGURE 6.
Electronic current traces for the preincorporation samples. Each panel contains a 1-min current trace that is ∼10 min after the data collection and a 3-s expanded region that highlights the signal. A, freshly prepared sample with a P:L ratio of 1:120. B, the same sample as in A but after 48-h incubation at 37 °C. C, cross-linked sample with a P:L ratio of 1:120 and after 48-h incubation at 37 °C. D, freshly prepared sample with a P:L ratio of 1:30.

