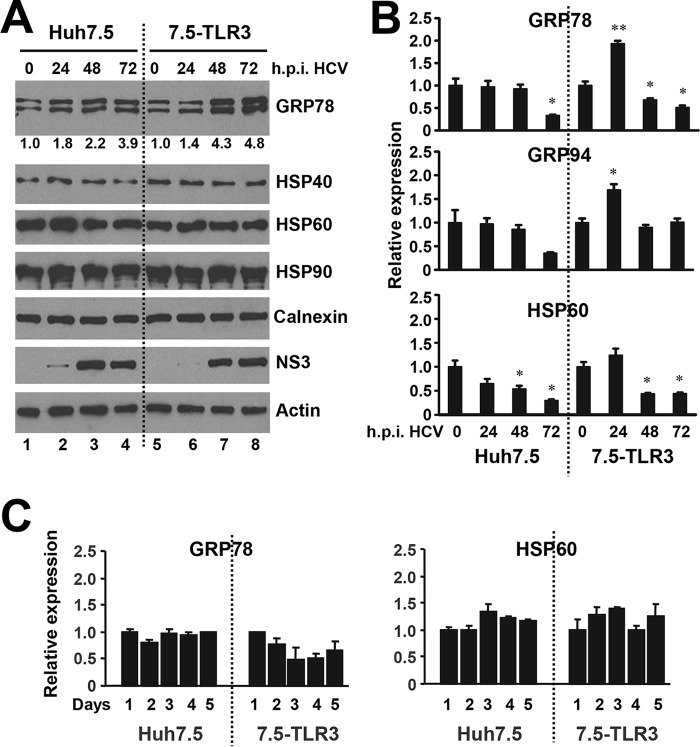
FIGURE 3.
Expression of molecular chaperones in hepatoma cells during HCV infection. A, immunoblotting of indicated chaperones, HCV NS3 and actin in Huh7.5 and 7.5-TLR3 cells at indicated times post-infection with JFH1 virus (m.o.i. = 0.25). Values below the GRP78 panel indicate fold changes relative to the GRP78 protein level at 0 h.p.i. after normalization of actin levels as determined by densitometry analysis using ImageJ software. B, qPCR analysis of GRP78, GRP94, and HSP60 mRNA levels in Huh7.5 and 7.5-TLR3 cells at indicated times post-infection with JFH1 virus (m.o.i. = 1). * and ** indicate statistical differences exist as compared with samples at 0 h.p.i., with a p value of <0.05 and <0.01, respectively. C, qPCR analysis of GRP78 and HSP60 mRNA levels in Huh7.5 and 7.5-TLR3 cells cultured for the indicated days. A representative of two independent experiments is shown. Error bars represent standard deviations of replicate samples.

