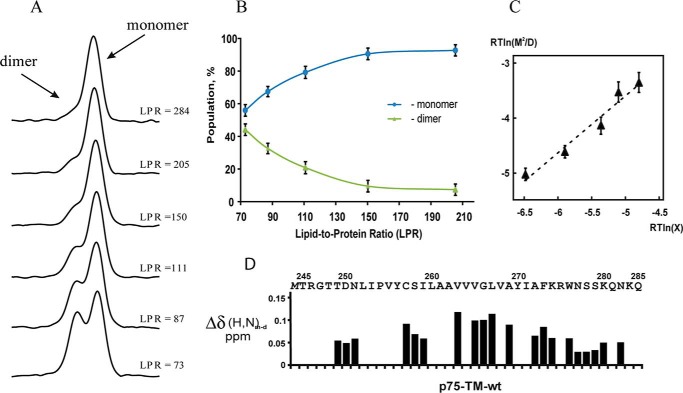
FIGURE 2.
Dimerization of p75-TM-WT in reducing conditions. A, dimer-monomer population values were calculated from the integrals of cross-peak projections in the 1H/15N TROSY spectra. B, percentage of the monomeric (blue) and dimeric (green) p75-TM-WT forms at different LPRs. C, calculation of the apparent free energy of dimerization of p75-TM-WT. ΔGapp = RTln([M]2/[D]) as a function RTln(X) where X = ([Det] − Nm[M] − Nd[D])/Ne. [M], [D], and [Det] represent monomer, dimer, and DPC concentration, respectively; Ne represents the number of DPC molecules per empty micelle; and Nm and Nd represent the number of DPC molecules per micelle containing monomer and dimer, respectively. D, chemical shift changes observed in p75-TM-WT dimerization in 20 mm DTT after titration at different LPRs. Error bars represent S.E.

