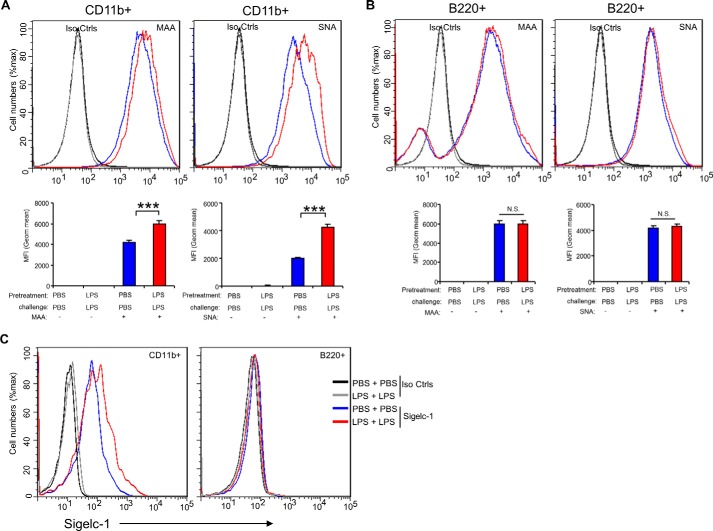
FIGURE 2.
Increased expression of α2,3 and α2,6 sialylation and Siglec-1 on spleen cells from endotoxin tolerant mice. C56BL/6J wild-type mice 6–8 weeks of age were intraperitoneally administrated LPS (4 μg/kg body weight). After 24 h, the mice were challenged with LPS (4 mg/kg body weight) for 4 h, and then spleen cells were collected and sialylation on the CD11b+ (A) and B220+ (B) cell surface was analyzed by flow cytometry. Histograms shown on top panels are FACS profiles. The bar graph bottom panels represent geometric means S.D. of fluorescence intensity (n = 3). Cell surface expression of Siglec-1 on the B220+ and CD11b+ cell surface was analyzed by flow cytometry (C). Data are representative of those from two independent experiments involving 3 mice per group.

