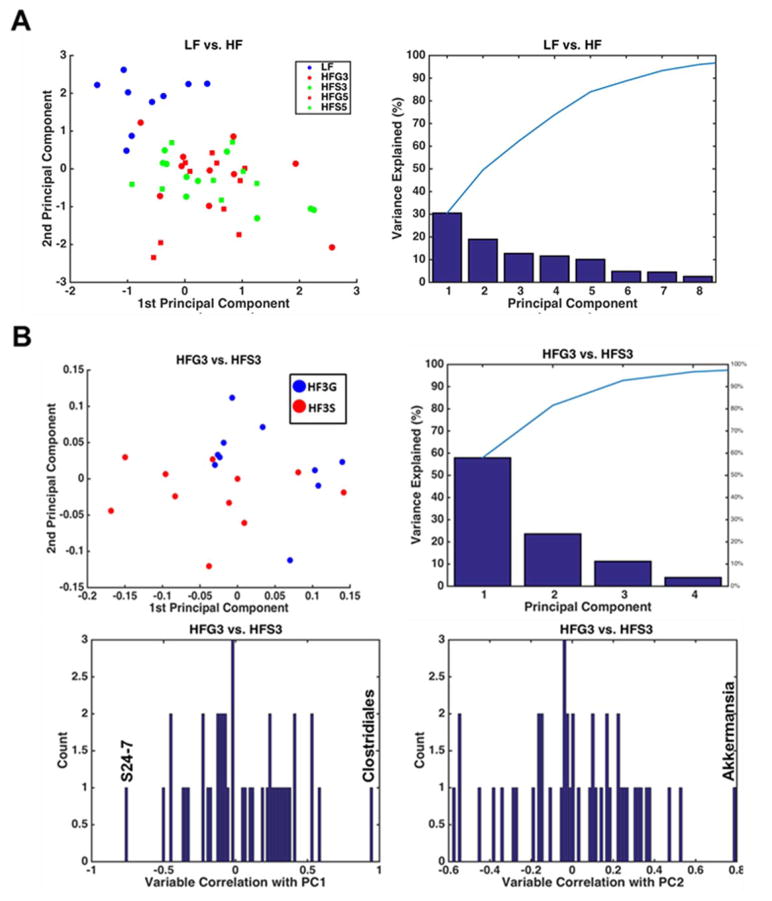
Figure 9.
The microbial relative abundances from C57BL/6J mice fed a low fat (LF) diet or high fat (HF), butter-rich diets with or without 3% or 5% powdered grapes for 10 weeks. (A) Top Left - PCA plot between low fat (LF) and HF + 3% grapes (HF3G) are shown. Top Right – Pareto plot showing percentage of variance explained by principal components. Below – Histogram showing individual genera that were negatively or positively correlated with LF and/or HF-3G diets. (B) Same as A, but showing PCA of HF-3G vs HF + 3% sugar (HF-3S) groups.

