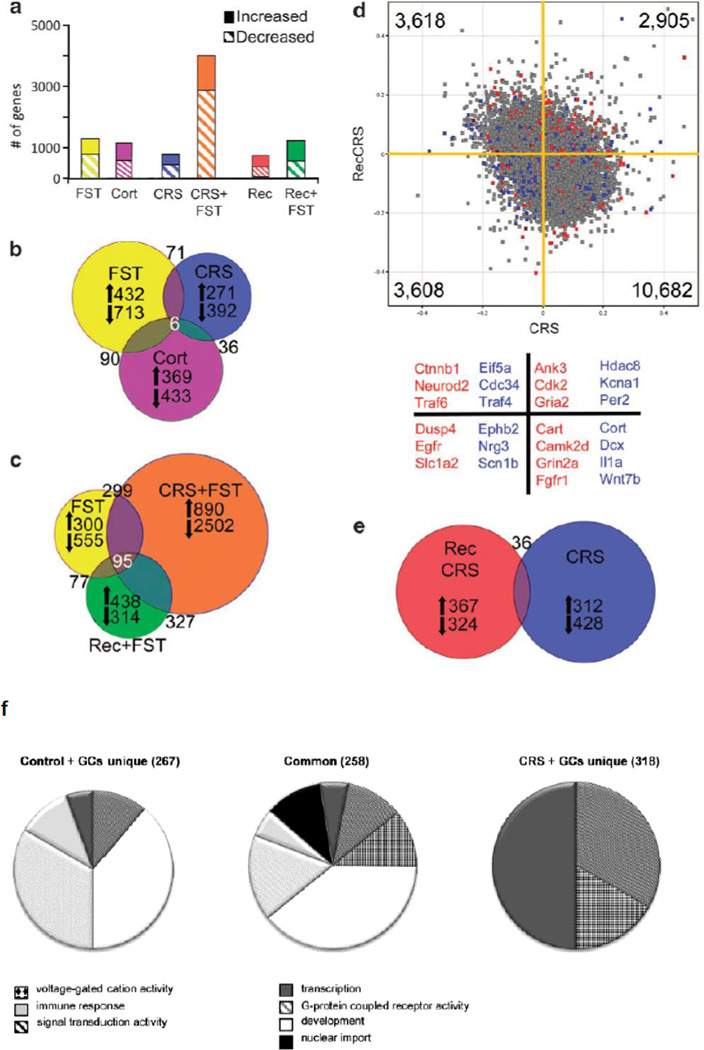
Figure 2. Gene expression changes in hippocampus in response to stress and glucocorticoid challenge depend on the prior stress history of the subject.
Hippocampal microarray data reveals stress-induced gene expression changes. (a) Solid bars represent the number of significantly increased genes and hatched bars represent significantly decreased genes identified by pairwise comparisons of each stress group with age-matched controls.
(b) Proportional Venn diagram illustrating the genes significantly altered by both the acute stress, chronic stress, and CORT injection conditions. The numbers of genes unique to each comparison that were increased or decreased are listed next to arrows indicating the direction of change.
(c) Venn diagram of genes altered by each FST condition reveals a core of 95 genes that were always changed by this stressor. The large number of unique gene expression changes in each condition shows that the response to FST is altered by the stress history of the group, with the vast majority of changes occurring when the animal is exposed to a novel stressor immediately after a chronic stress exposure, as also shown in (a).
(d) Scatter plot of normalized expression values for each microarray probe comparing CRS (x axis) with recovery from CRS (y axis). The majority of genes are increased by CRS, but decreased after recovery; however, there are a number of probes that are increased by CRS that remain elevated after recovery or are suppressed by CRS and remain low in recovery. Highlighted probes are those that reached significance when compared with age-matched controls (blue=CRS, red=recovery from CRS, gray=not significant). Several examples of the highlighted genes are listed below the scatter plot by color designation and quadrant. For example, blue points in the lower left quadrant, such as Nrg3 and Scn1b, represent genes that are significantly changed by CRS when compared with unstressed controls and are also decreased after recovery from CRS. Whereas red points in the upper right quadrant, such as Cdk2 and Gria2, are genes that remained significantly different from controls after recovery from CRS, and were also increased immediately following CRS.
(e) Venn diagram illustrating that the number of genes significantly different from controls after recovery from CRS are mostly unique from those significantly altered by CRS. Reprinted from18 by permission.
(f) Pie charts of overrepresented GO-terms among the 576 genes that were differentially expressed upon GC-challenge in naive versus chronically stressed rats. The differentially expressed genes were divided in a group that responded to GCs in both controls and CRS animals (center) or only in controls (left) or in CRS animals (right). The pie charts represent the GO-terms that were overrepresented in the 3 groups of GC-responsive genes and show that after CRS, GC-challenge gives rise to a different gene signature than in control animals. From20 by permission.

